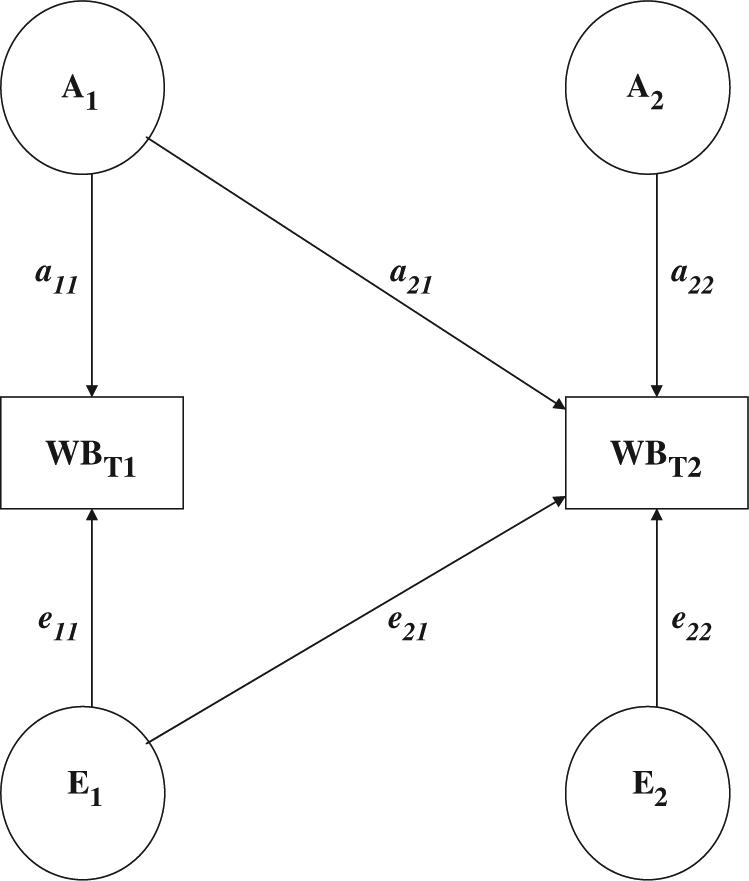
Figure 1.

A path diagram of an AE Cholesky model for Well-being (WB) at Time 1 (T1) and Time 2 (T2). For the sake of parsimony, shared environmental effects were omitted from this diagram, and the paths are only shown for one member of a twin pair. In this model the variance at each time point is decomposed into additive genetic (A1, A2,) and nonshared environmental effects (E1, E2). a11 & e11 = paths representing additive genetic and nonshared environmental contributions to the Time 1 phenotype, respectively; a21 & e21 = paths representing additive genetic and nonshared environmental contributions from Time 1 to the Time 2 phenotype, respectively; a22 & e22 = paths representing additive genetic and nonshared environmental contributions unique to the Time 2 phenotype, respectively. These paths are squared to estimate the proportion of variance accounted for by additive genetic and nonshared environmental influences.
