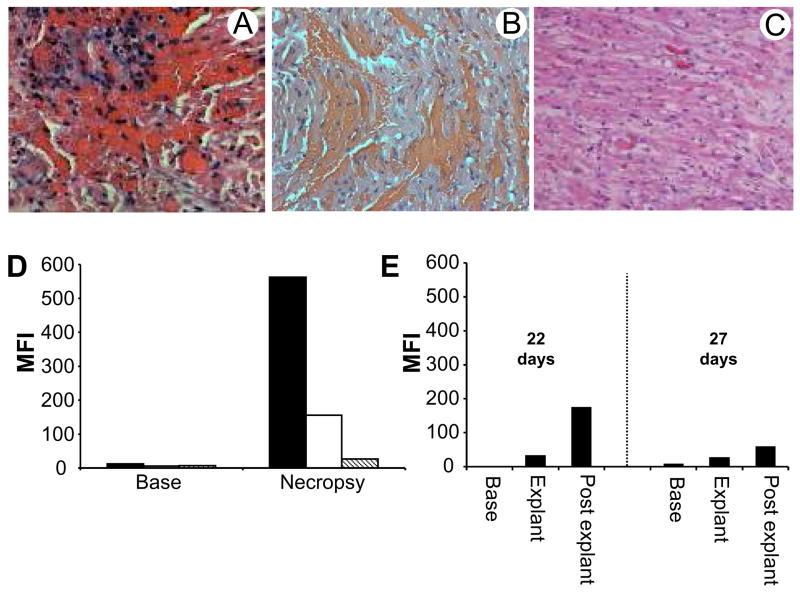
Figure 1.
Histology and antibody responses after cardiac xenotransplantation. A. Representative histology of Group A rejected xenografts exhibiting florid intragraft cellular infiltration. B. Histology showing widespread hemorrhage of a GT-KO Group B xenograft rejected 90 minutes after reperfusion. C. Typical histology of Group B rejected xenografts showing microvascular thrombosis and myocardial ischemic injury. D. The graph shows mean fluorescence intensity of IgG staining on GT-KO PAECs stained with pretransplant (Base) and necropsy serum (Necropsy) from Group A recipients. No treatment (black), treated with TPC (white) and treated with TPC and Rituximab (striped). E. Graph shows mean fluorescence intensity of IgG binding to GT-KO PAEC after staining with pretransplant (base), explant and post explant serum from Group B recipients that rejected their grafts on days 22 and 27.

