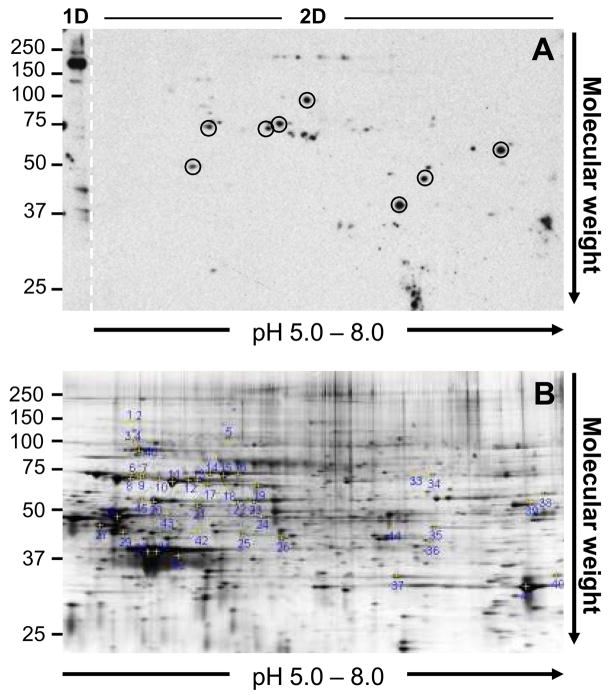
Figure 3.
Proteomic analysis of non-Gal antigens. A. Representative 2D Western blot of Group A IgG binding to membrane enriched GT-KO PAEC antigens. The left edge of the gel (labeled 1D and demarcated with a dashed line) contains an individual lane of GT-KO PAEC membrane enriched antigens which were separated by molecular weight in one dimension only. The remainder of the gel (labeled 2D) is the second dimension separation of membrane enriched antigens after previous isoelectric focusing through a pH 5 – 8 IPG strip. The circled spots in the Western corresponded to immunoreactive spots which aligned with spots in the total protein gel and were excised for nanoLC/MS/MS peptide analysis. Note that the prominent immunoreactive band above 150kDa detected after separating membrane enriched proteins by molecular weight only (see 1D section) lacks a corresponding spot when the membrane enriched antigens are separated by both isoelectric focusing and molecular weight (see 2D section). B. A representative syproRed stained 2D gel showing total protein distribution and indicating the position of each spot recovered and analyzed in this study. The Western blot in A and the total protein gel in B are not matched.

