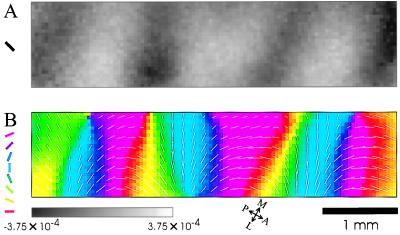
Figure 1.
A linear sequence of orientation preference along the border between areas 17 and 18. The set of visual stimuli included eight differently oriented gratings, moving in both directions orthogonal to the orientation. (A) Pattern of cortical response to a single grating pattern, presented in the format of a single-condition orientation map. Dark zones represent cortical areas that preferentially responded to the orientation as marked to the left of the image (135°). The activated zones are elongated and appear at similar intervals. (B) “Angle” representation of the orientation map obtained from the same part of cortex. The preferred orientation at any location is color-coded according to the color code presented to the left of the image. Superimposed are short lines that represent the local preferred orientation and the magnitude of preference by their angle and length, respectively. The preferred orientation changes continuously in an approximately linear manner parallel to the long dimension of the image obtained along the 17/18 border. In contrast, preferred orientation is approximately constant in a direction orthogonal to the border. The scale of gray levels represents the fractional changes of the pattern of response presented in A. A, anterior; P, posterior; M, medial; L, lateral. (Bar = 1 mm.) Similar conventions are used in subsequent figures.

