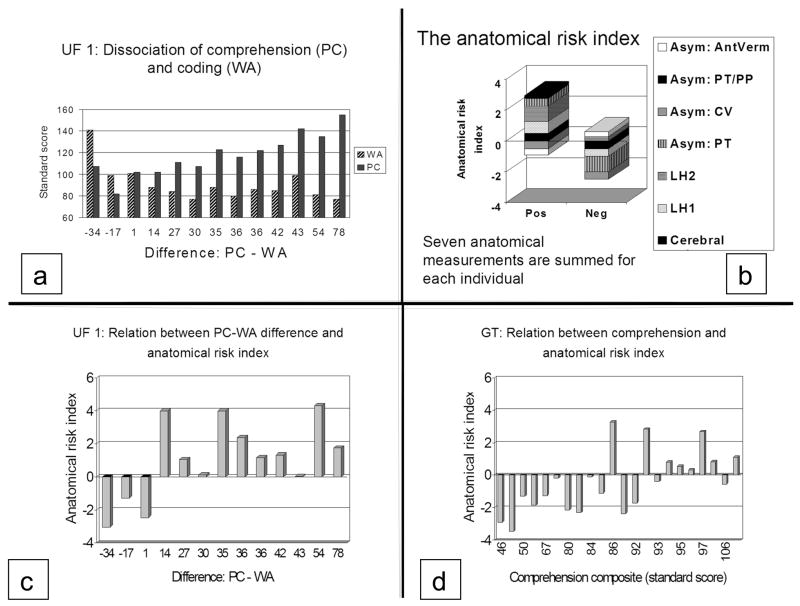
Figure 7.
Results from anatomical risk index studies. A: College students ranked in order of their discrepancy between PC and WA. B. Graphic depiction of how the seven anatomical measurements are added together to produce positive and negative indices. AntVerm: anterior lobe of the cerebellar vermis; PT/PP: summed asymmetries of the planum temporale and planum parietale; CV: cerebral volume (adjusted for sex); LH2: surface area of second Heschl’s gyrus (left); LH: surface area of first Heschl’s gyrus (left). C. Relationship between anatomical risk index and PC-WA discrepancy. Students ordered as in 7a. Students with negative or small discrepancies have negative anatomical risk indices. Students with large positive discrepancies have positive anatomical risk indices. D. GT sample: children with poor comprehension tend to have negative anatomical risk indices while children with normal comprehension tend to have positive anatomical risk indices.

