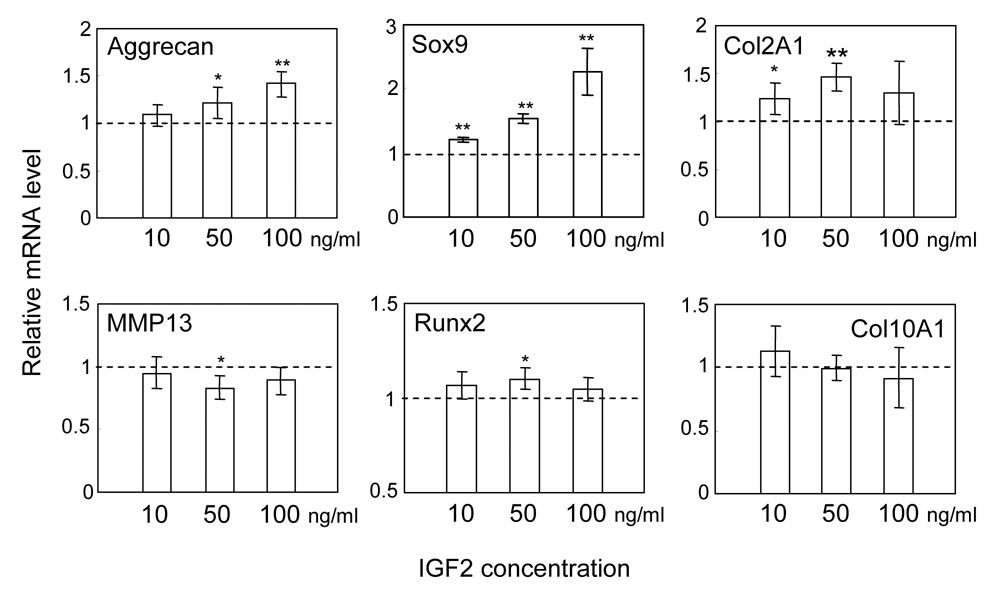
Figure 1.
Alterations in mRNA levels of Aggrecan, Sox9, Col2A1, MMP13, Runx2 and Col10A1 in response to 10, 50, and 100 ng/ml IGF2 for 5 h. The relative mRNA level was normalized by the level of control cells without IGF2 administration. The asterisks indicate statistical significance at P<0.05 (*) and P<0.01 (**).

