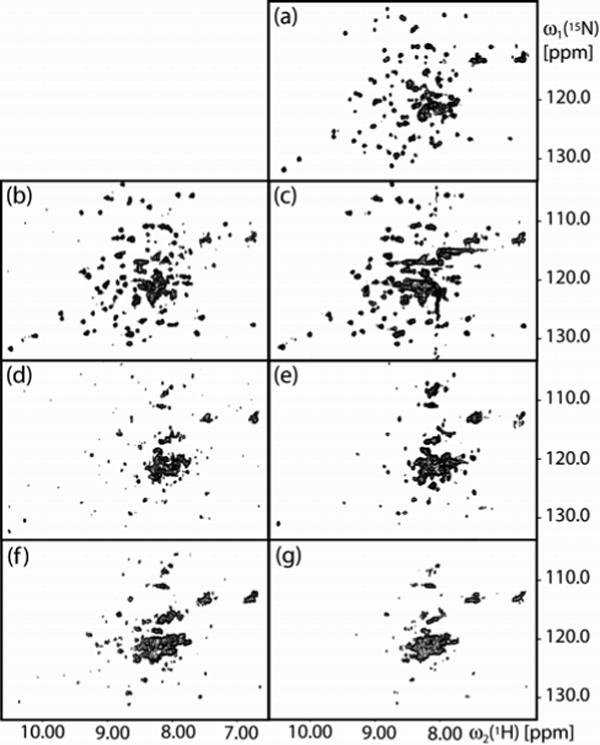
Figure 4.

2D [15N,1H]-TROSY correlation NMR spectra of uniformly [2H,15N]-labeled OmpX reconstituted in mixed micelles with different detergents: (a) DHPC. (b) 138-Fos. (c) 179-Fos, where the vertical band of peaks near 8.0 ppm represents t1-noise from the signal of the amide proton of 179-Fos. (d) 115-Fos. (e) TPC. (f) 34-Fos. (g) 185-Fos. The spectra were collected with the following parameters: data size 50 (t1) × 1024 (t2) complex points; t1max = 25 ms; t2max = 86 ms; 300 scans per t1 increment, overall measurement time = 9 hours per experiment. Before Fourier transformation, the data matrices were multiplied with an exponential window function in the acquisition dimension, and with a 75°-shifted sine bell window46 in the indirect dimension.
