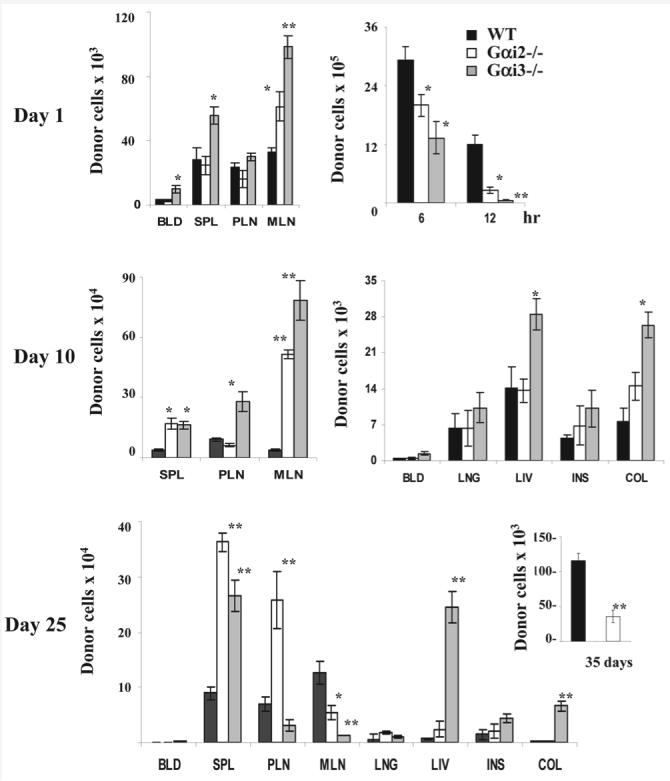
Figure 3.

Effects of Gαi2 and Gαi3 on donor T cell tissue distribution at indicated times after adoptive transfer. T cells isolated from WT, Gαi2−/− or Gαi3−/− mice were labeled with CFSE and injected into SCID BALB/c mice at a dose of 107 T cells/mouse. The total numbers of donor T cells in different tissues were obtained on the basis of percentages of CD3+ cells at days 1 (top), 10 (middle), 25 (low), and 35 (inset in the lower panel). Donor T cells in the cavity lavage were also shown after 6 and 12 h injection (top right panel). BLD, blood; SPL, spleen; PLN, peripheral lymph nodes; MLN, mesenteric lymph nodes; LNG, lung; LIV, liver; INS, intestine; and COL, colon. Results are the mean ± SD of three independent experiments each with three mice per time point (n=9 at each time point). *p<0.05 or **p<0.01 as analyzed by a Wilcoxon signed rank test.
