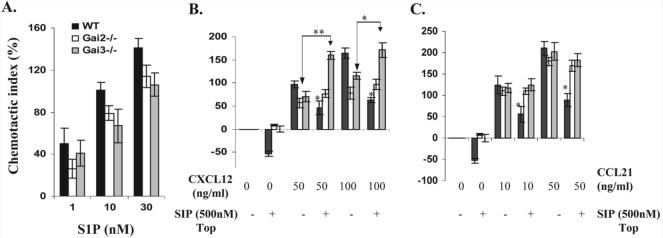
Figure 6.
Chemotactic responses of non-stimulated T cells in the presence or absence of a Gαi protein. (A) T cells freshly isolated from WT, Gαi2−/− and Gαi3−/− mice were added to the upper chamber and S1P at the indicated concentrations was added to the lower chamber. After 4-h incubation, the migrated cells in the lower chamber were counted and expressed as mean chemotactic indexes ± SD of cell migration toward S1P relative to control medium as defined in the Materials and methods. (B and C) T cells isolated from indicated mice, along with 500 nM S1P, were added to the upper chamber and varying concentrations of CXCL12 (B) and CCL21 (C) were added to the lower chamber. Migration was assayed as in (A) and data are presented as mean chemotactic indexes ± SD of cell migration toward CXCL12 or CCL21 relative to control medium. Cumulative data from at least six (A) or three (B and C) experiments with each in triplicate are shown. Statistic significance (*p<0.05 or **p<0.01) in the presence vs. absence of a specific Gαi protein.

