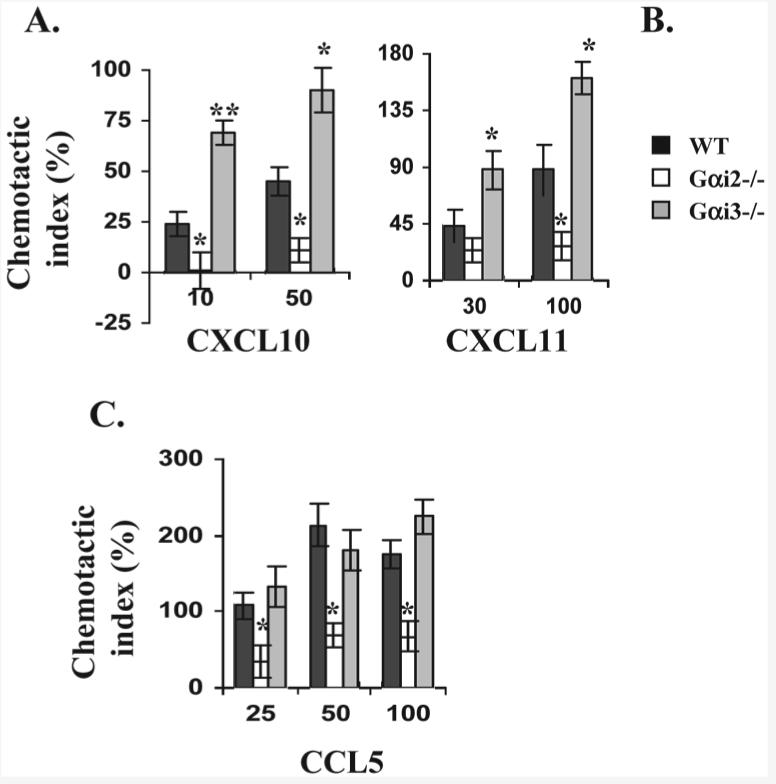
Figure 7.

Chemotactic responses of activated T cells in the presence vs. absence of Gαi2 or Gαi3. T cells isolated from the indicated mice were either stimulated for 6 days with irradiated splenocytes isolated from SCID BALB/c mice (A and B) or stimulated with ConA for 4 days (C). Chemotaxis of the resultant cells was assayed as in Fig. 6A. Data are presented as mean chemotactic indexes ± SD of cell migration toward CXCL10 (A), CXCL11 (B), and CCL5 (C) relative to control medium. Cumulative data from at least six (A) or three (B and C) experiments with each in triplicate are shown. Statistic significance (*p<0.05 or **p<0.01) in the presence vs. absence of a specific Gαi protein.
