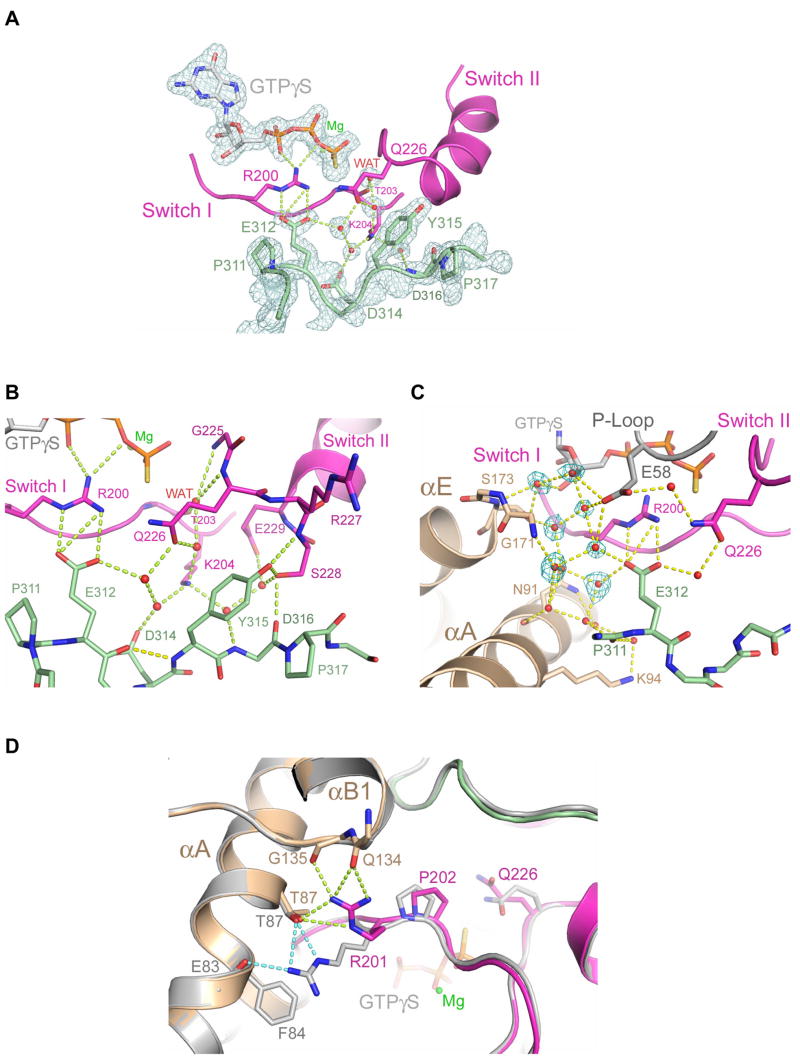
Figure 4.
GTPase active site in the PRG-rgRGS:Gα13·GTPγS complex. (A) Electron density (cages) at the active site from a 2.0 Å σA-weighted 2Fo−Fc difference map is contoured at 1.6 standard deviations above the mean. Only densities of the PRG-rgRGS N-terminus, GTPγS, Mg2+ and key water molecules are shown. Hydrogen bonds are drawn as dotted lines. (B) Ribbon diagram depicting extensive contact between the N-terminus of PRG-rgRGS and the switch regions of Gα13. Hydrogen bonds are drawn as dotted lines. The hydrogen bond between E312 and Y315 as a result of the 310 helical fold is colored yellow. (C) Ribbon diagram depicting water-mediated contact between the N-terminus of PRG-rgRGS and the helical domain and P-loop of Gα13. Electron density (cages) for the seven additional water molecules, which are only present in the GTPγS complex, is shown. Hydrogen bonds are drawn as dotted lines. (D) Structural comparison of active sites from the PRG-rgRGS:Gα13·GTPγS complex and PRG-rgRGS:Gα13·GDP·AlF4− complex. The PRG-rgRGS:Gα13·GDP·AlF4− complex is colored gray. Hydrogen bonds between Arg-201 and the helical domain are drawn as dotted lines and colored lime in the GTPγS complex and light blue in the GDP·AlF4− complex. The distance between the Cα atom positions of Arg-201 in these two structures when superimposed is about 0.8 Å.

