
Fig. 3.
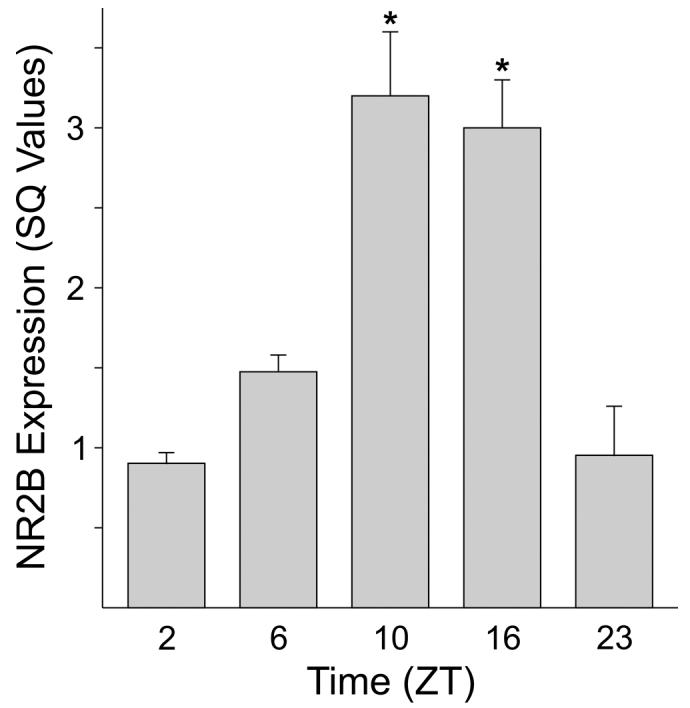
NR2B transcripts are rhythmically expressed in SCN tissue. Semi-quantitative RT-PCR was used to measure levels of the transcript. The SQ values shown are determined by a standard curve and normalized to the housekeeping gene beta-2 microglobulin. The histogram plots the mean results of 3 independent experiments with error bars representing SEM. For each experiment, SCN tissue was collected from 15 mice at 5 time points (ZT 2, 6, 10, 16, 23) with mRNA from each time point pooled from 3 mice. Values were analyzed with ANOVA followed by Tukey test for pairwise comparisons. Astericks indicate significance at P < 0.05 compared to sample at ZT 2.