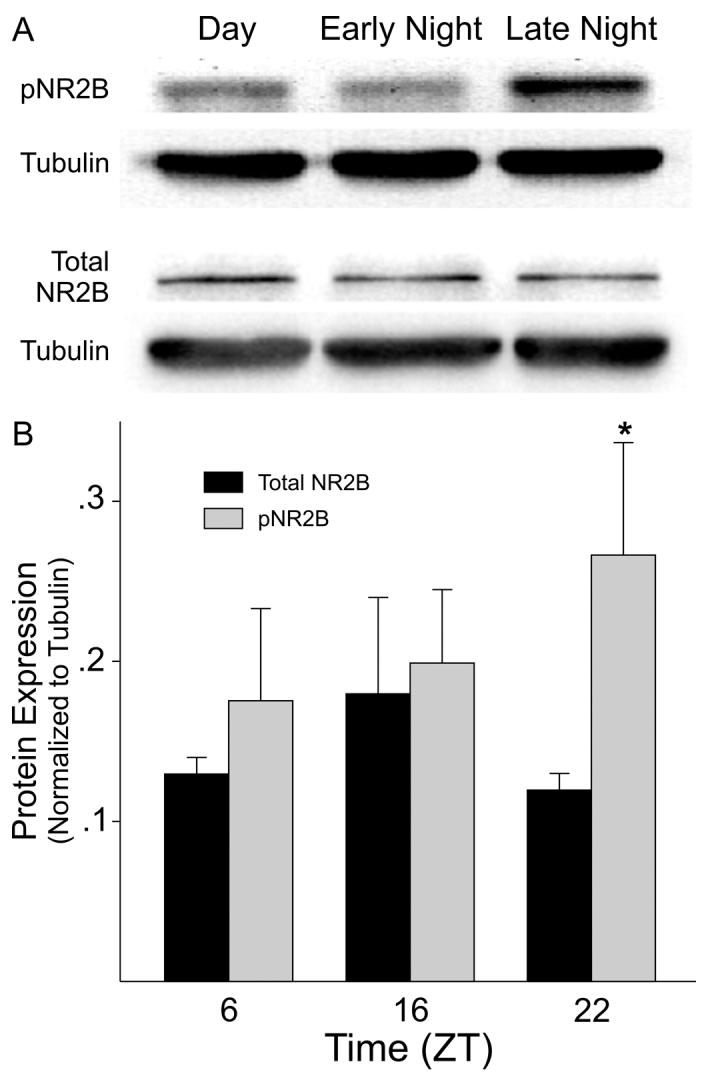
Fig. 4.

Phospho-NR2B levels vary with time of day in SCN tissue. Western blots were used to measure levels of phospho-NR2B and total NR2B. A) Top panels show examples of the blots. B) Histograms plot the mean results of 3 independent experiments with error bars representing SEM. Values are shown normalized to tubulin. For each experiment, SCN tissue was collect from mice at 3 time points (ZT 6, 16, 22) with protein extracts from each time point pooled from 3 mice. Values were analyzed with ANOVA followed by Tukey test for pairwise comparisons. Asterick indicates significance at P < 0.05 compared to sample at ZT 6.
