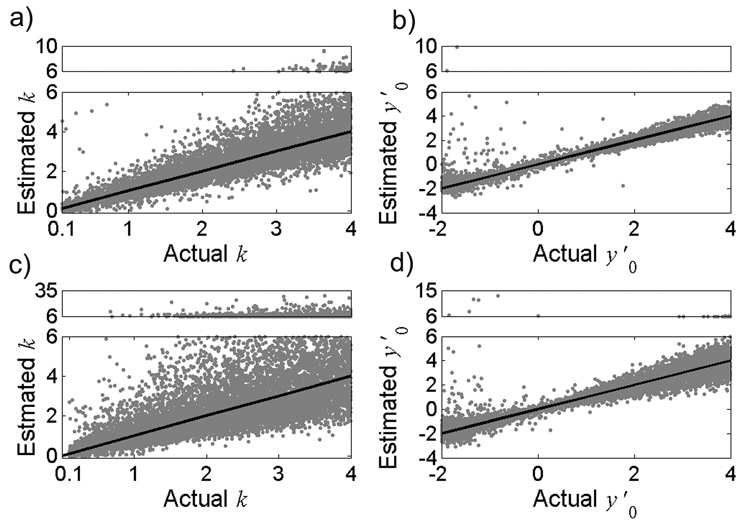
Figure 3.
Model sensitivity to errors in Vth and geometric angles θ, Φ, and Ψ (Table 1). Model estimates (n=10,000) of a) k and b) y′0 as a function of the actual parameter values for σ = 2°. Model-estimates of c) k and d) y′0 as a function of the actual parameter values for σ = 4°. Solid lines represent unity slope. Note that estimates greater than 6 are shown in the upper box of each plot, where the y-axis scale is condensed. Nine outliers of the estimated y′0 are not shown in b) and 6 outliers are not shown in d) for clarity.

