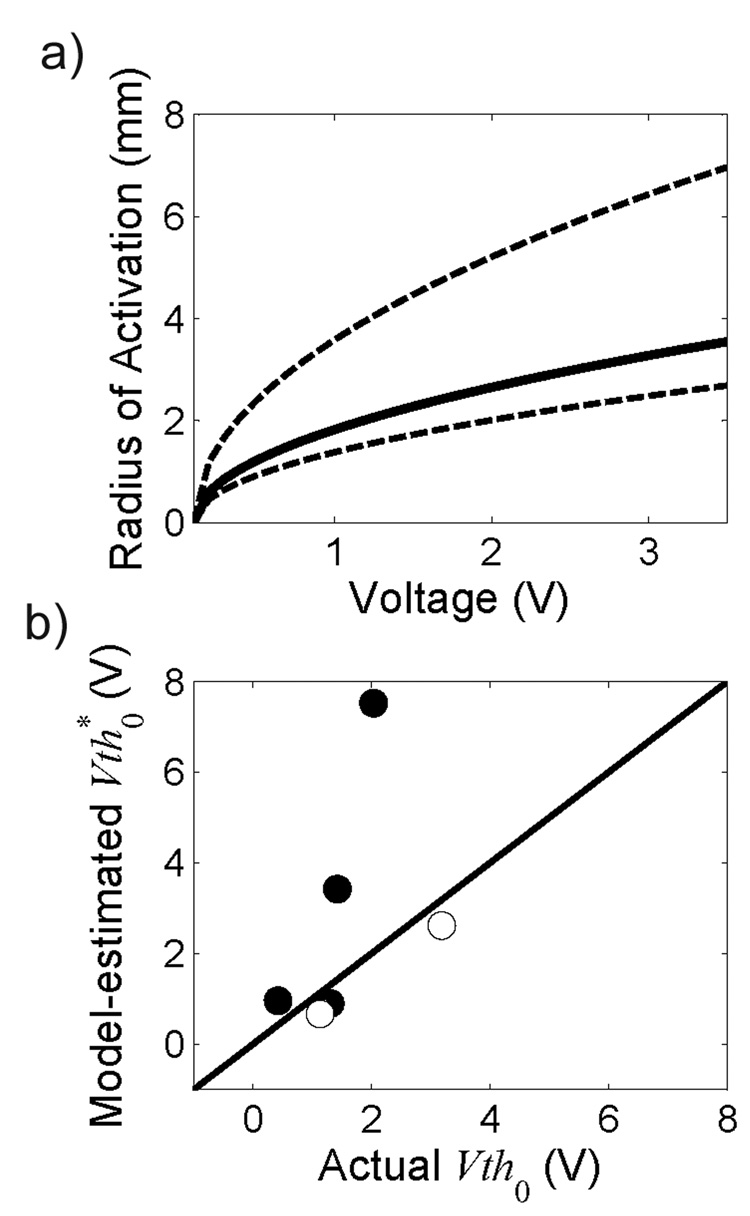
Figure 5.
a) Effective radius of activation as a function of stimulation voltage predicted using the mean threshold-distance constant k = 0.22 V/mm2. Dashed lines represent ±1 standard deviation around the mean (solid line). b) Model-estimated threshold amplitudes for contact 0, calculated as Vth*0 = v + ky′0 2 (where v = 0.1 V and k = 0.22 V/mm2) as a function of the actual threshold voltage required to elicit a side effect with contact 0. Black circles represent 4 thalami with θ > 20°, and white circles represent 2 thalami with θ < 20°. Solid line is unity slope.

