
Figure 2.
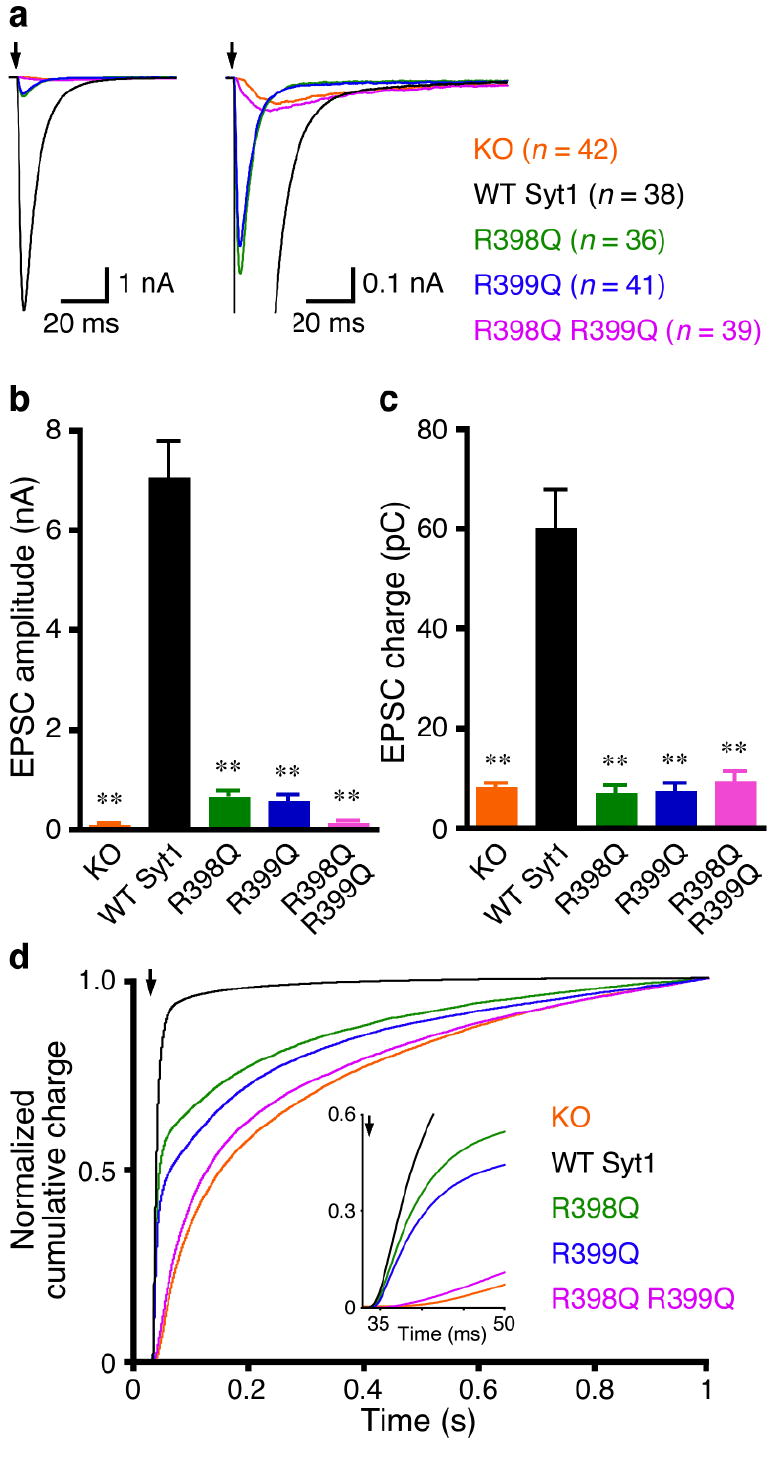
The bottom face of the synaptotagmin-1 C2B domain is critical for fast Ca2+-triggered neurotransmitter release. (a) Average traces of basal evoked EPSCs of hippocampal synaptotagmin-1 KO neurons and KO neurons rescued with WT and mutant synaptotagmin-1 (Syt1) variants. Arrows represent 2–ms somatic depolarizations to 0 mV. Depolarization artifacts and action potentials were blanked. (b,c) Summary data of EPSC amplitude (b) and charge (c). Data are expressed as mean ± s.e.m. ** P < 0.001 as compared to KO neurons rescued by WT synaptotagmin-1. (d) Summary plot of the normalized cumulative EPSC charge in 1 s. The inset shows the same normalized cumulative EPSC charge within the first 50 ms. Numbers of neurons analyzed in (a-d) are indicated in panel (a).