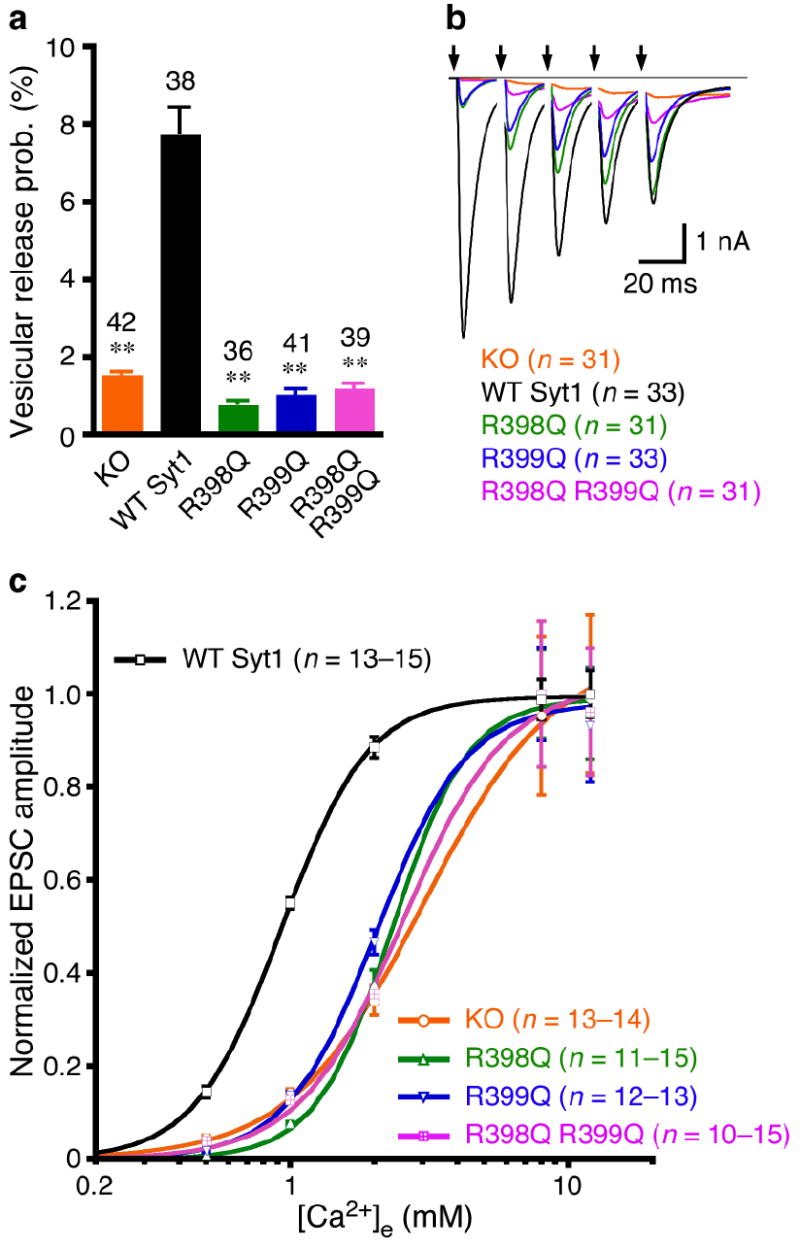
Figure 3.

The bottom face of the synaptotagmin-1 C2B domain regulates probability and Ca2+-sensitivity of release. (a) Summary data of vesicular release probability from synaptotagmin-1 KO neurons and KO neurons rescued with WT and mutant synaptotagmin-1 variants. Data are expressed as mean ± s.e.m. ** P < 0.001 as compared to KO neurons rescued by WT synaptotagmin-1. (b) Average traces of 5 consecutive EPSCs evoked at 50 Hz. Arrows represent 2–ms somatic depolarizations to 0 mV. Depolarization artifacts and action potentials were blanked. (c) Apparent Ca2+-sensitivity of evoked release. Normalized amplitudes of synaptic responses were plotted against external Ca2+ concentrations ([Ca2+]e). Data are expressed as mean ± s.e.m. and fitted with standard Hill equation. KO, Kd = 3.0 ± 0.2 mM, WT Syt1, Kd = 0.93 ± 0.01 mM, R398Q, Kd = 2.3 ± 0.1 mM, R399Q, Kd = 2.0 ± 0.1 mM, R398Q,R399Q, Kd = 2.6 ± 0.3 mM. Numbers of neurons analyzed in (a-c) are indicated in the panels.
