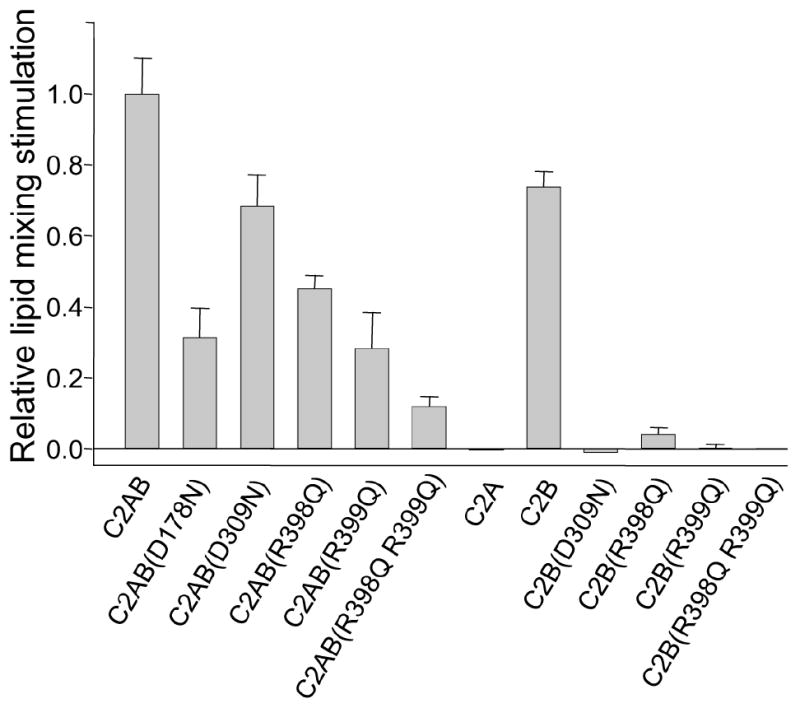
Figure 6.

Relative fusion stimulation activities of synaptotagmin-1 fragments. Lipid mixing assays analogous to those shown in Fig. 5 were performed for each synaptotagmin-1 fragment. The increase in F/F0 during the 40 seconds following Ca2+ addition was measured, and the background Ca2+-independent lipid mixing was subtracted by linear extrapolation from the data acquired before Ca2+ addition. The resulting values were normalized to the average F/F0 increase observed for the WT C2AB fragment in parallel experiments with the same proteoliposome concentrations. Error bars show standard deviations from triplicate experiments.
