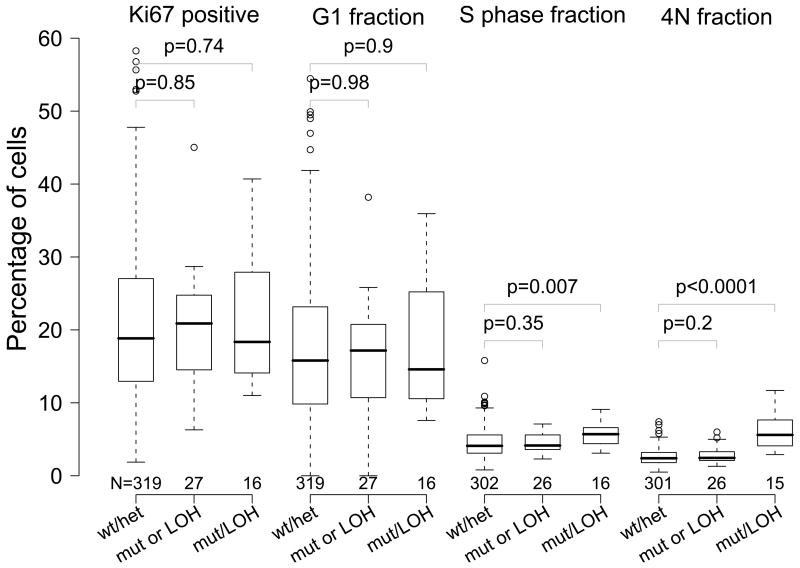
Figure 2.
Ki67-positive, G1 phase, S phase, and 4N fractions of biopsies by TP53 inactivation status. Measurements from biopsies no TP53 inactivation (TP53 wt/17p het), with either TP53 mutation or 17p LOH (TP53 mutation or 17p LOH), and both mutation and LOH (TP53 mutation and 17p LOH) are summarized. The boxes indicate median and middle two quartiles, the whiskers the 95th percentiles, and the outliers are plotted as circles. The number of samples in each group is printed below each box. The biopsies with no TP53 inactivation (TP53+/+) were compared with the other two groups (TP53+/− and TP53−/−) using the Wilcoxon rank sum test, and the p values are shown on the plot.

