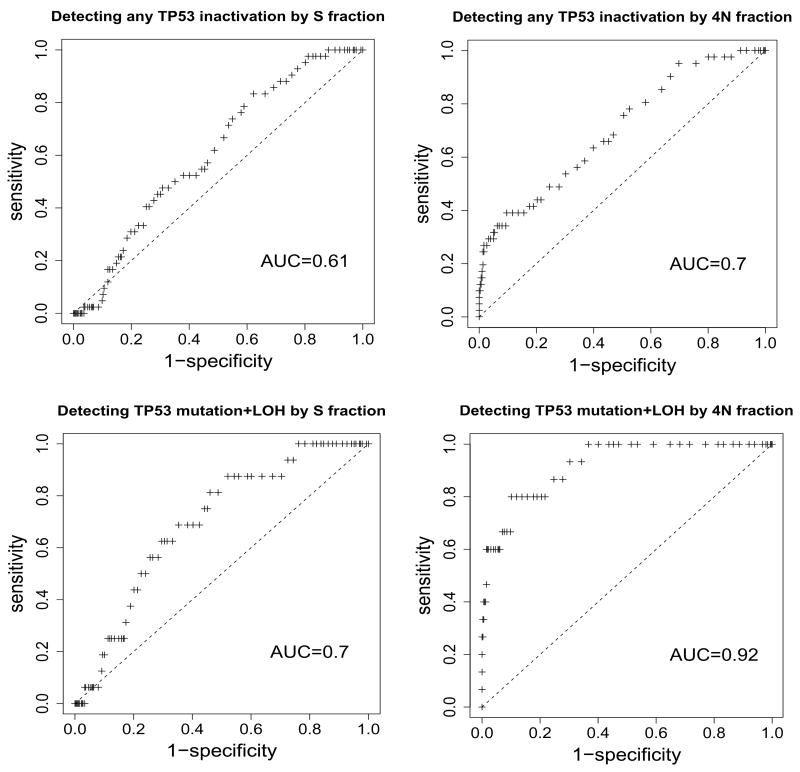
Figure 3.
Receiver operating characteristic (ROC) curves for detecting TP53 inactivation by mutation or LOH in diploid samples using S or 4N fractions. The upper plots are ROC curves for discriminating between biopsies with no detectable TP53 inactivation and those with any inactivation. 42/344 biopsies in which TP53 inactivation and S phase fractions were ascertained had detectable TP53 mutation or LOH, and 41/342 biopsies in which TP53 inactivation and 4N fractions were ascertained had detectable TP53 mutation or LOH. The associated areas under the curves (AUC) are indicated. The lower plots are ROC curves for discriminating between biopsies with both forms of TP53 inactivation (mutation and LOH) and all other biopsies. 16/344 biopsies had detectable TP53 mutation and LOH in the S phase plot, and 15/342 biopsies had detectable TP53 mutation and LOH for the 4N plot.

