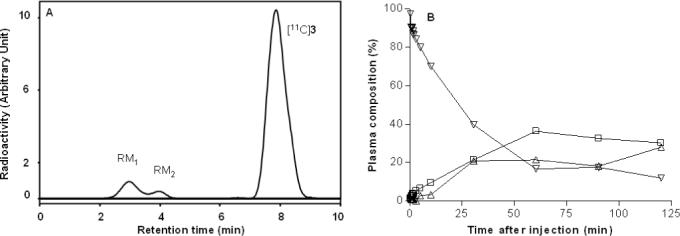
Figure 5.

HPLC of plasma at 10 min after i.v. [11C]3 injection into rhesus monkey (Panel A) under baseline conditions. Corresponding time course of radioactivity in plasma (%) represented by parent radioligand and radiometabolite fractions (Panel B). Key: ▽, parent radioligand, [11C]3; □, radiometabolite fraction, RM1; △, radiometabolite fraction, RM2.
