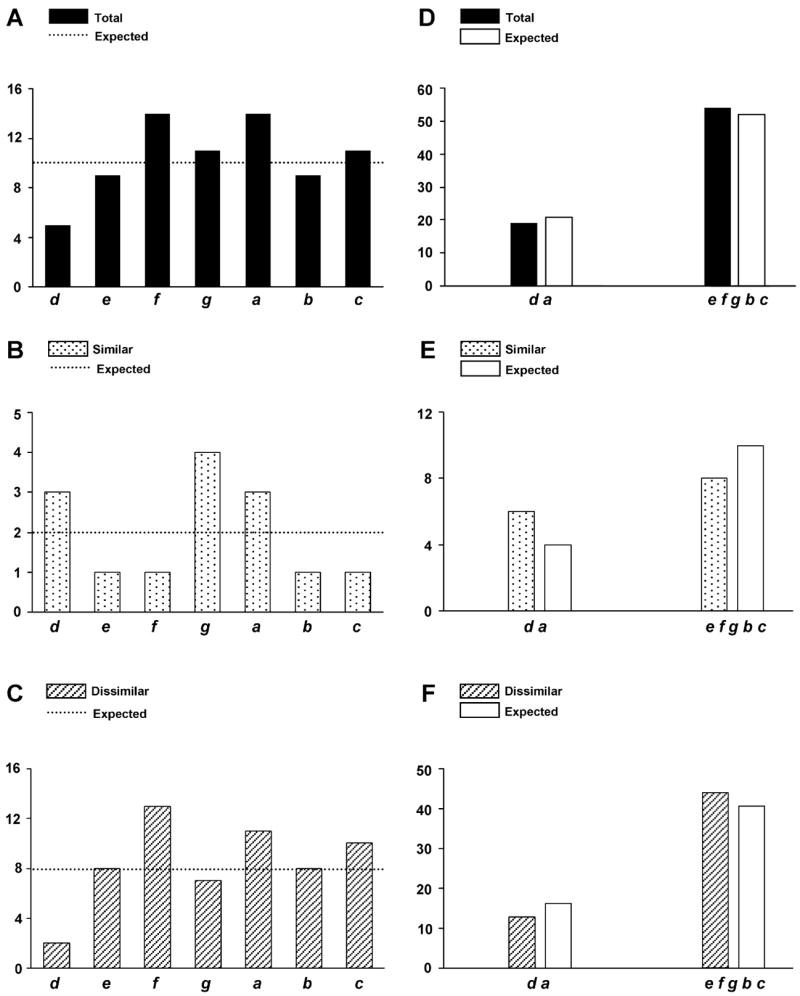
Figure 3.

Analysis of mutations located in the heptad repeats of the rod. Black columns correspond to the total number of observed mutations (similar plus dissimilar), dotted and striped columns correspond to the number of similar and dissimilar observed mutations respectively. White columns and dotted lines correspond to the theoretical number of expected mutations. d, e, f, g, a, b, c indicate the heptad repeat positions. Distribution of total (A), similar (B) and dissimilar (C) mutations in each position of the heptad repeat. Comparison of total (D), similar (E) and dissimilar (F) mutations in the internal d and a positions and the exposed e, f, g, b, c positions.
