
Figure 9.
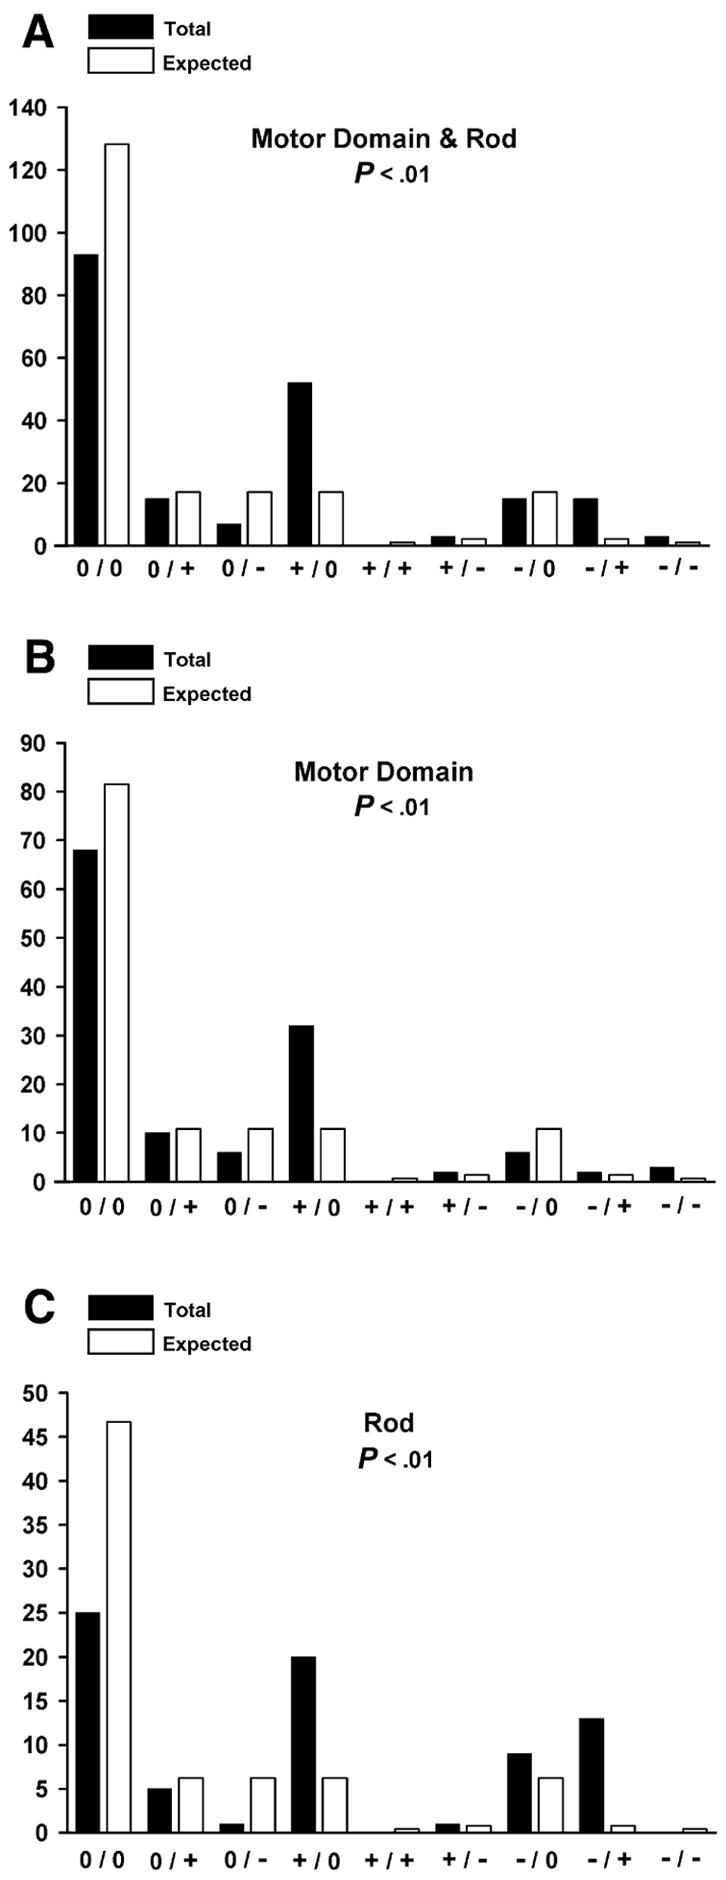
Amino acid charge transition analysis. Black columns correspond to the number of observed charge transitions; white columns correspond to the theoretical number of expected charge transitions. Entire myosin molecule (A), motor domain (B) and rod (C). p < 0.01 indicates that all numbers of transitions observed are significantly different than expected.