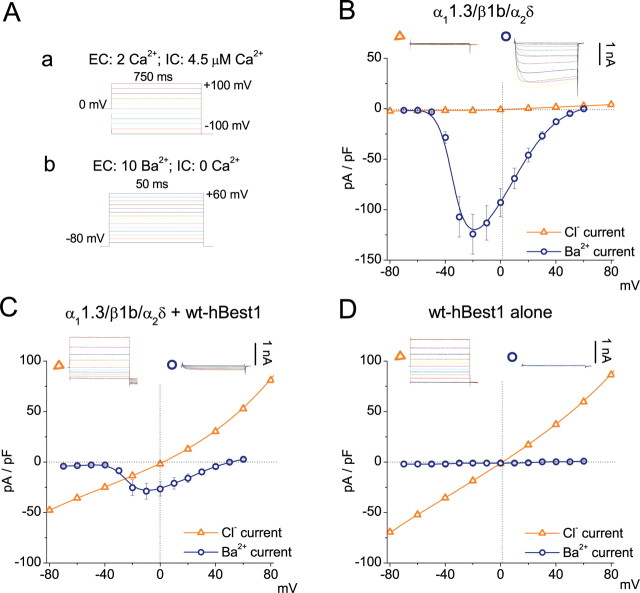
Figure 1.
Inhibition of CaV1.3 currents by coexpression of hBest1. A, Voltage protocols used to record whole-cell Ca2+-activated Cl− current (a) and Ba2+ current (b) from transfected HEK293 cells. Ba2+ currents were measured by 50 ms voltage pulses from a holding potential of −80 mV to various depolarizing voltages in cells bathed with 10 mm [Ba2+]o and <20 nm [Ca2+]i. Cl− currents were measured by 750 ms voltage steps in 20 mV increments from −100 to +100 mV from a holding potential of 0 mV in cells bathed with 2 mm [Ca2+]o and >600 nm [Ca2+]i. B–D, I–V relationships for Ca2+-activated Cl− current (triangle) and Ba2+ current (circle) recorded from HEK293 cells transfected with CaV1.3 (α11.3/β1b/α2δ) alone (B), α11.3/β1b/α2δ plus hBest1 (C), or hBest1 alone (D). Representative current traces are shown above. The peak current densities at the end of the test pulse were plotted against test voltage. Each point represents the mean of 10–15 cells.

