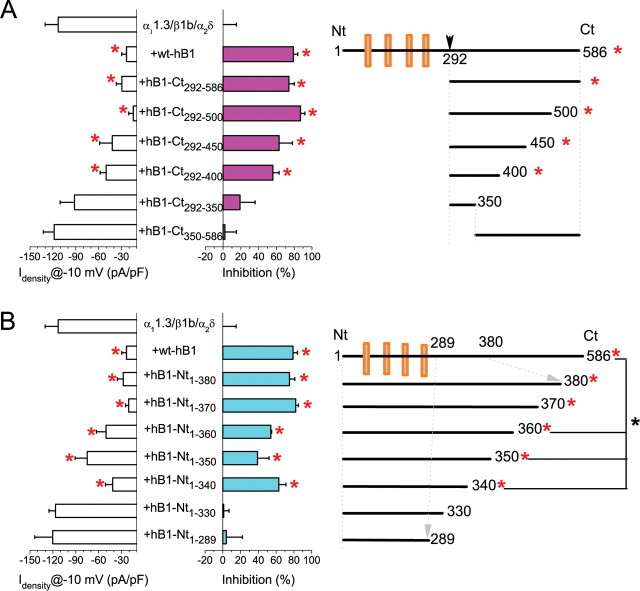
Figure 4.
Identification of critical region of hBest1 required for Cav1.3 inhibition. A, Averaged Ba2+ current densities recorded during 50 ms test pulse at −10 mV for α11.3/β1b/α2δ either alone or with hBest1 or six hBest1 C-terminal fragments. The percentage of inhibition compared with control (α11.3/β1b/α2δ alone) is also shown. B, Averaged Ba2+ current densities recorded during 50 ms test pulse at −10 mV for α11.3/β1b/α2δ either alone or with hBest1 and six hBest1 N-terminal fragments. The right panels show the design for hBest1 fragments. Each averaged value represents the mean of 10–15 cells. *p < 0.05 for each group compared with CaV1.3 alone by two-way ANOVA.

