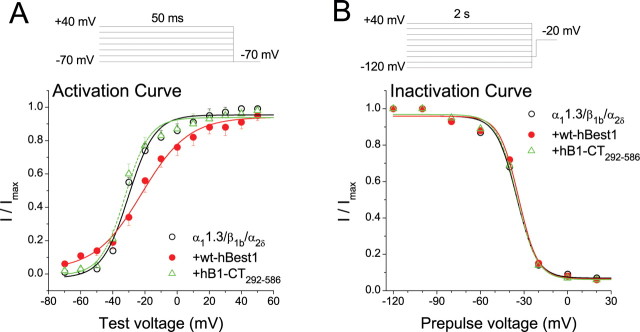
Figure 6.
Effects of hBest1 and hBest1-CT292–586 on CaV activation and inactivation. A, Normalized tail current activation curves for cells transfected with α11.3/β1b/α2δ alone (open circle) and α11.3/β1b/α2δ plus hB1-Ct292–586 (triangle) and α11.3/β1b/α2δ + hBest1 (filled circle). B, Steady-state inactivation curves for cells transfected with α11.3/β1b/α2δ alone (open circle), α11.3/β1b/α2δ plus hB1-Ct292–586 (triangle), and α11.3/β1b/α2δ plus hBest1 (filled circle). Peak Ba2+ currents were measured during 20 ms test step at −20 mV after 2 s conditioning pulses in the range of −120 to +40 mV (20 mV increments) and normalized to the largest in the series.

