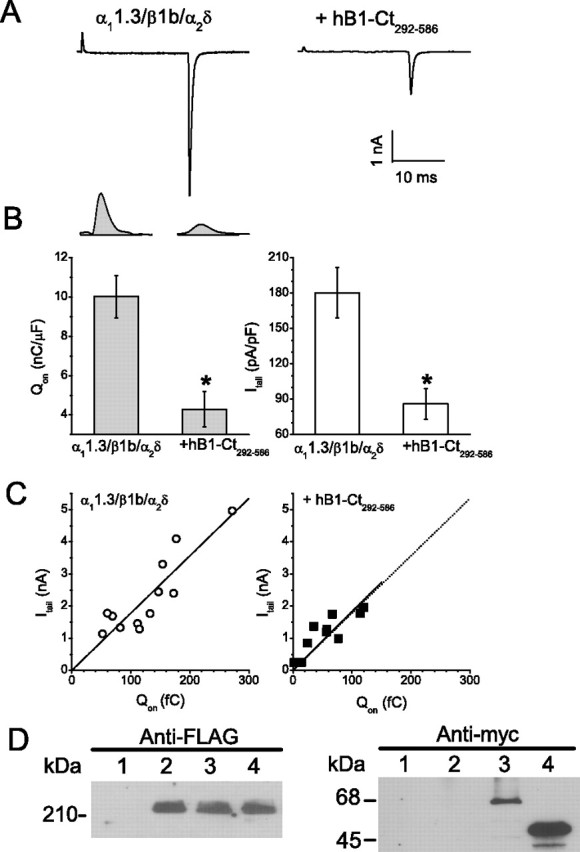
Figure 7.

Effect of hBest1 on CaV1.3 gating currents. A, Exemplar currents from cells transfected with α11.3/β1b/α2δ alone and α11.3/β1b/α2δ plus hB1-Ct292–586. Currents were evoked with a 20 ms test pulse to +60 mV followed by a −60 mV repolarization. B, The left panel presents QON measurements for each group with exemplar gating current isolated at the reversal potential shown above. The right panel presents the averaged tail current densities recorded simultaneously for each group. *p < 0.01 for α11.3/β1b/α2δ plus hB1-Ct292–586 compared with α11.3/β1b/α2δ alone by two-way ANOVA. C, Scatter plot of tail current amplitude versus QON and regression line for cells transfected with α11.3/β1b/α2δ alone (left) and α11.3/β1b/α2δ plus hB1-Ct292–586 (right). The regression line for α11.3/β1b/α2δ alone is reproduced (gray) in the right panel to facilitate direct visual comparison. D, Cells were untransfected (lane 1) or transfected with CaV1.3 (FLAG-α11.3/β1b/α2δ) alone (lane 2), CaV1.3 plus wt-hBest1 (lane 3), and CaV1.3 plus hBest1-CT292–586 (lane 4) and subjected to lysis. An equal amount of supernatant proteins was detected by Western blotting with antibodies recognizing FLAG-epitopes (left) or myc-epitopes (right).
