
Figure 11. Integrin endocytosis in caveolin-1-knockdown cells.
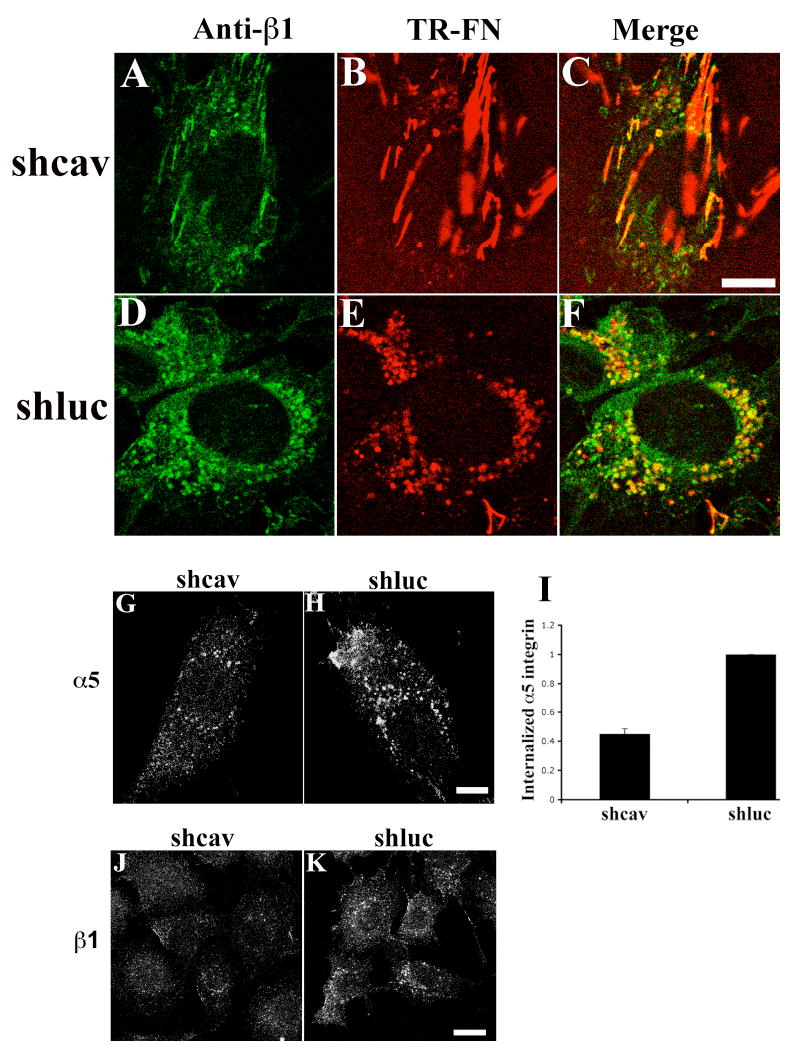
(A-F) Cells expressing caveolin-1 siRNA (shcav) or control cells (shluc) were incubated with 10 μg/mL TR-fibronectin overnight. Cells were washed, and then incubated for 8 hours in cell culture media lacking fibronectin, but containing 50 μM chloroquine. Cells were stained with anti-β1 integrin antibody (FITC). Upper panels, shcav; lower panels, shluc. A and D, β1 integrin; B and E, TR-fibronectin; C and F, overlay images. (G-K) Cells expressing caveolin-1 siRNA (shcav, G,J) or control cells (shluc, H,K) were incubated with 50 μg/mL antibodies to α5 integrin (G-I) or β1 integrin (J, K) at 4°C for 45 minutes. Cells were then processed for integrin endocytosis assay as described in Methods. The fluorescence intensity of endocytosed α5 integrin (G, H) was quantitated using a MATLab based program. (I) Fold change relative to the fluorescence intensity of endocytosed α5 integrin in shluc cells, which was set equal to 1 (mean±range from 2 independent experiments). All images are optical sections collected from a confocal microscope. Scale bar, 10μm.