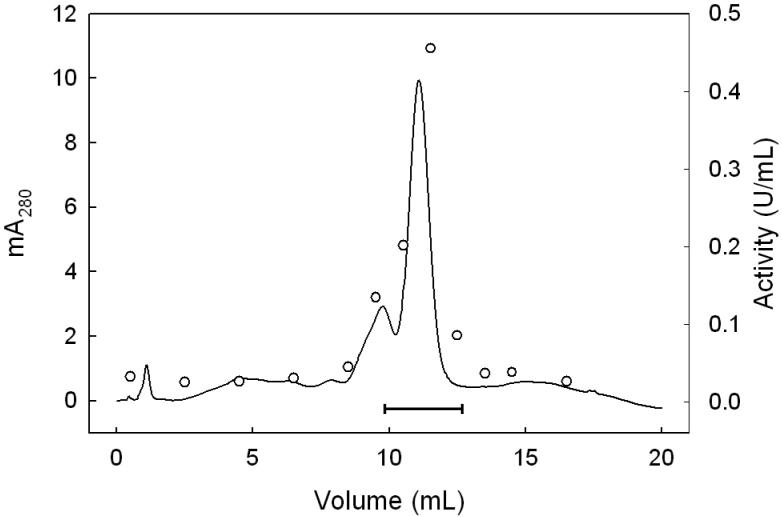
Figure 3.
Protein profile for HiTrap SP column chromatography. KME Buffer D was pumped through the column up to 3 mL of effluent (not shown), after which a linear gradient (0-100% KME Buffer E) was started, reaching 100% Buffer E at 15 mL. This was maintained for another 5 mL before switching back to 100% Buffer D. Fractions of 1.0 mL were collected throughout at a flow rate of 1.0 mL/min. Solid line represents protein concentration (A280); circles represent CuOOH-based enzymatic activity. Bar indicates fractions that were pooled for purity and activity determinations.

