
Figure 6.
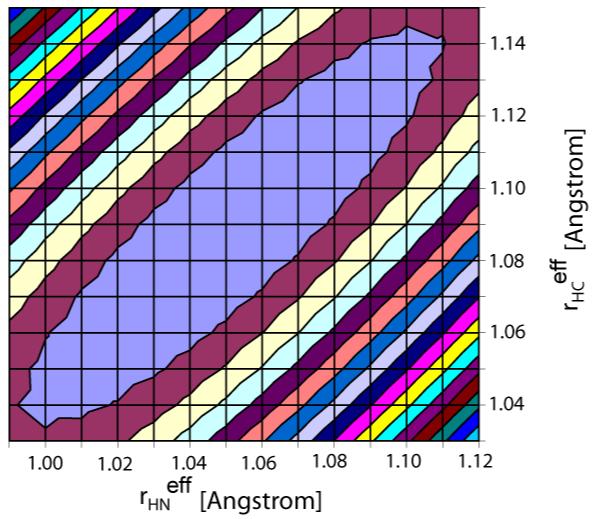
RMSD between experimental and predicted sequential DHNHα couplings in GB3 versus rHN and rCαHα bond lengths for the 160-conformer ensemble. Equidistant lines are drawn in steps of 0.03 Hz above the minimal rmsd of 1.16 Hz (at rHN = 1.05 Ǻ and rCαHα = 1.09 Ǻ). The blue ellipse covers bond length pairs with an rmsd which is not statistically significantly larger than the minimal rmsd (<1.19 Hz).