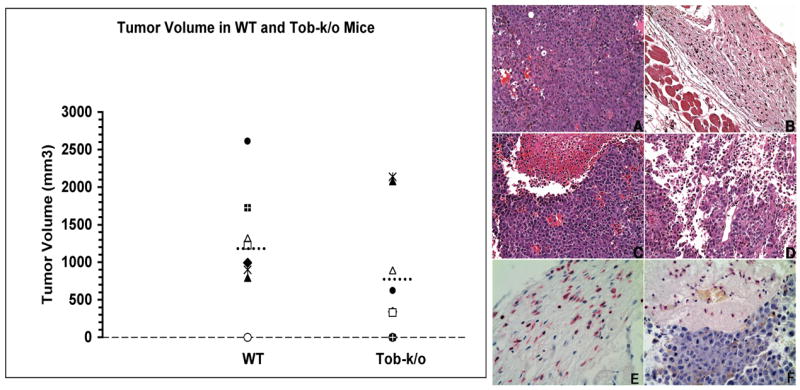
Figure 3. Tumor growth is delayed in Tob1−/− mice.

Left: Littermates (8 WT and 8 Tob1-k/o) from Tob1+/− heterozygous breedings were challenged sq with 2.5 × 10⁴ B16 melanoma cells. Graph shows 3-D tumor volume for each pair 17 days after challenge. Dashed lines represent mean tumor volume. A trend was present for smaller tumors in Tob1-k/o. Right: Representative sq sections from wild type (A) or Tob1-deficient mice (B–F) 21 days after injection with B16 melanoma cells. There is a high mitotic rate, no inflammation, and visible vascularization of tumors in WT mice (A), in contrast to dermal and subcutaneous inflammatory infiltrates (B, C, D), hemorrhagic necrosis (C, D), severe edema and reduced vascularization (D) in Tob−/− mice. (H&E, 200X magnification). (E) and (F) show immunohistochemical staining for leukocytes using CD18 (red-staining cells). (E) is the same tumor as (B). (F) is the same tumor as (C). Note abundant leukocytes in the subcutis, extravasating neutrophils and inflammatory cells infiltrating the tumors (400X magnification). Gross measurable tumor volumes in the mice shown were (A) 1,320 mm3, (B) 0 mm3, (C) 891 mm3, and (D) 340 mm3.
