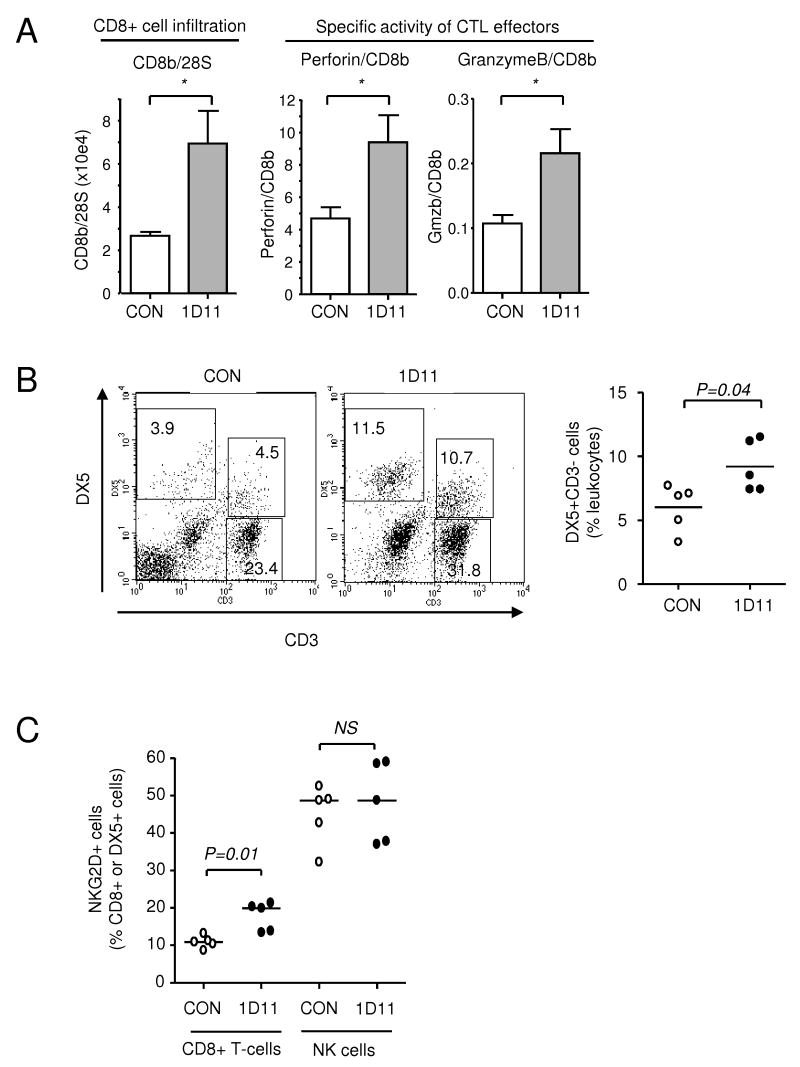
Figure 3. Effect of 1D11 treatment on numbers of immune cells and markers of activity.
A. RTQ-PCR analysis of mRNA levels of CD8b, and of the cytotoxic T-cell effectors, perforin and granzyme B from primary tumors treated with anti-TGF-β (1D11) or control (CON) antibody. Results are the mean +/- SD for 5 tumors/treatment group. P<0.05. B and C. FACS analysis of immune cells recovered from tumor-bearing lungs of mice injected orthotopically with 4T1 cells and treated with anti-TGF-β (1D11) or control (CON) antibody. Lungs were harvested at day 28, digested with collagenase, enriched for viable cells using a Percoll gradient, and then immune cells were analyzed for expression of specific markers by FACS. B. Representative FACS plot for determination of the effect of antibody treatment on the representation of T-cells (CD3+) or NK cells (CD3-DX5+) in the leukocyte gate by dual immunostaining. The scatter plot shows the % NK cells in the leukocyte gate for 5 mice/treatment group. Median values are indicated. C. The % of cells expressing the activator/coactivator NKG2D was determined individually for the CD8+ and the DX5+ (NK) cell populations for 5 mice/group. Median values are indicated.

