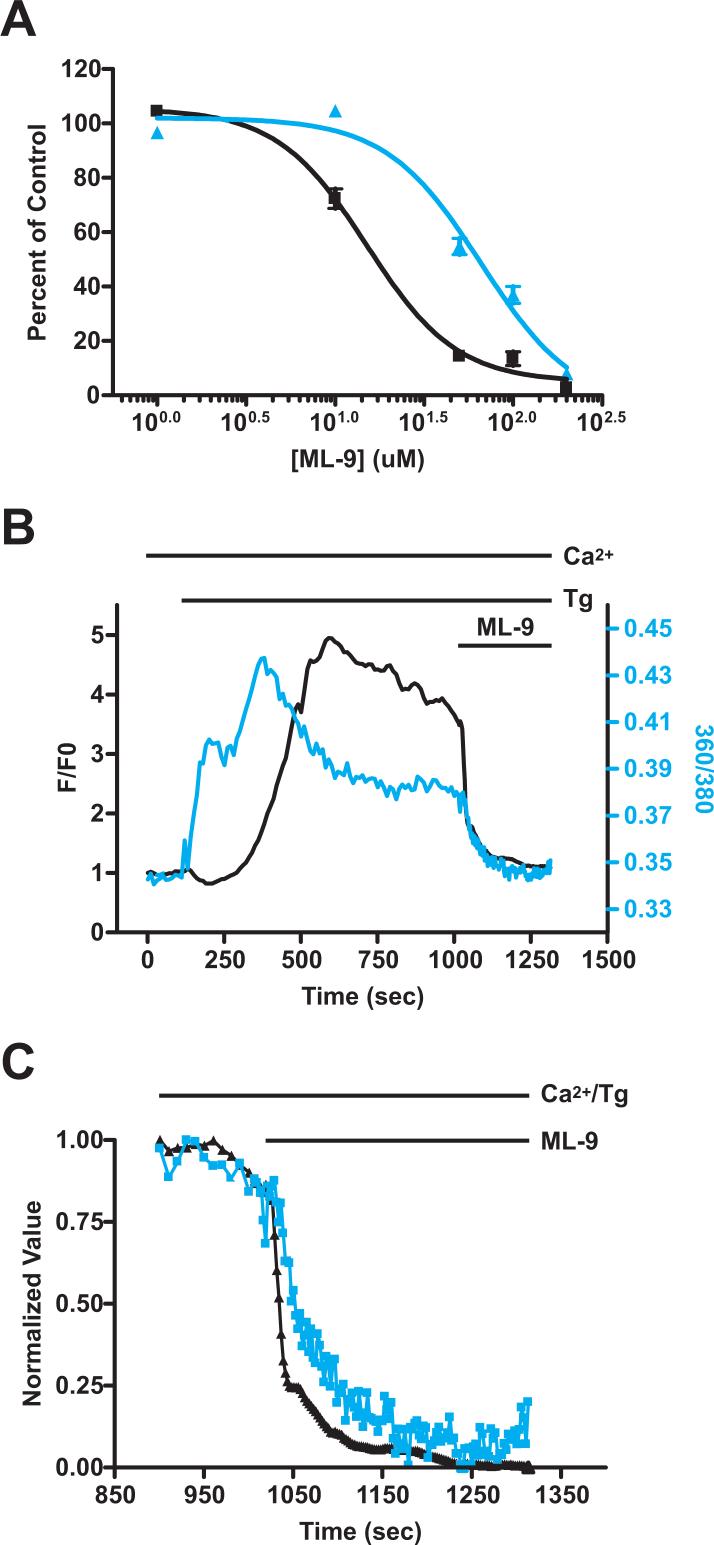
Figure 6. Inhibition of SOCE and Icrac by ML-9 is due to inhibition of Stim1 rearrangement.
A) SOCE experiments were performed in which ML-9 was added following restoration of extracellular Ca2+ as described in Figure 3C. As described in Figure 3D, SOCE following ML-9 addition as a percent of untreated control was calculated, and is plotted as a function of ML-9 concentration for HEK293 cells overexpressing unconjugated EYFP (black squares) and EYFP-Stim1 (blue triangles). B) TIRFM fluorescence intensity (black trace) and relative intracellular Ca2+ concentration (360/380 ratio; blue trace) were measured simultaneously in the same cell. Ca2+ stores were depleted with thapsigargin (Tg; 2 μM) in the presence of 1.8 mM extracellular Ca2+, and 100 μM ML-9 was added 15 minutes later. C) For the data shown in (B), the TIRFM (black trace) and 360/380 (blue trace) values beginning just prior to ML-9 addition were normalized to the same minimum and maximum values.

