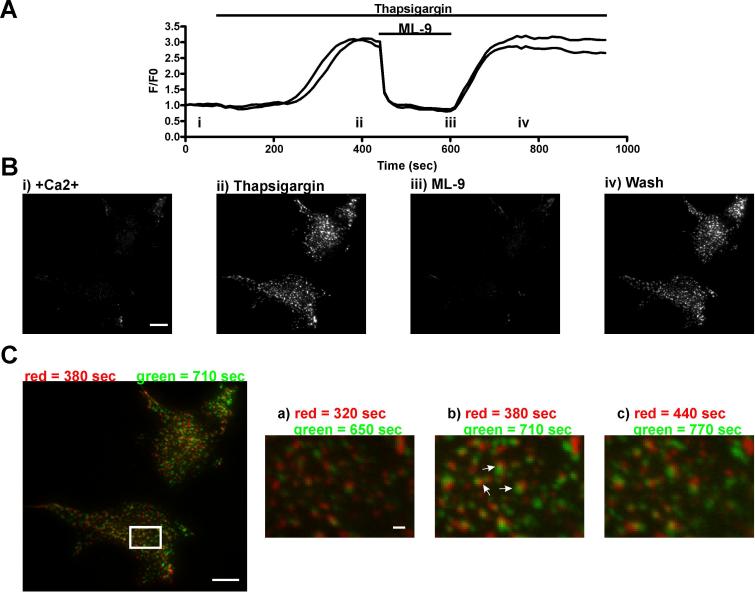
Figure 9. Single EYFP-Stim1 punctae form in similar locations upon multiple rearrangement stimuli.
A) Two EYFP-Stim1-expressing HEK293 cells were imaged by time-lapse TIRFM, during which Ca2+ stores were depleted with 2 μM thapsigargin in the presence of nominal extracellular Ca2+, 100 μM ML-9 was added to reverse punctae formation, and ML-9 was removed to restimulate punctae formation. Shown is the fluorescence intensity profile, with each trace representing a single cell. B) Representative TIRFM images taken at the times indicated (i-iv) in the intensity profile in panel A. The complete image series of this experiment is shown in Supplemental Movie 4. C) The TIRFM image taken at 380 seconds (store-depleted with thapsigargin prior to ML-9 treatment) was pseudocolored red. This image was then merged with the image taken at 710 seconds (after ML-9 washout), which was pseudocolored green. Image b on the right is a close-up of the region denoted by the white rectangle in the full-size image on the left. Image a was generated from the merge of the images 60 seconds prior to the images used to generate the full-size image on the left, and image c was generated from the merge of the images 60 seconds after the images used to generate the full-size image on the left. The arrows in image b point to pairs of red and green punctae that remain consistent throughout the series of merged images. Scalebars = 10 μm, except in images a-c in panel C in which the Scalebar = 1.0 μm

