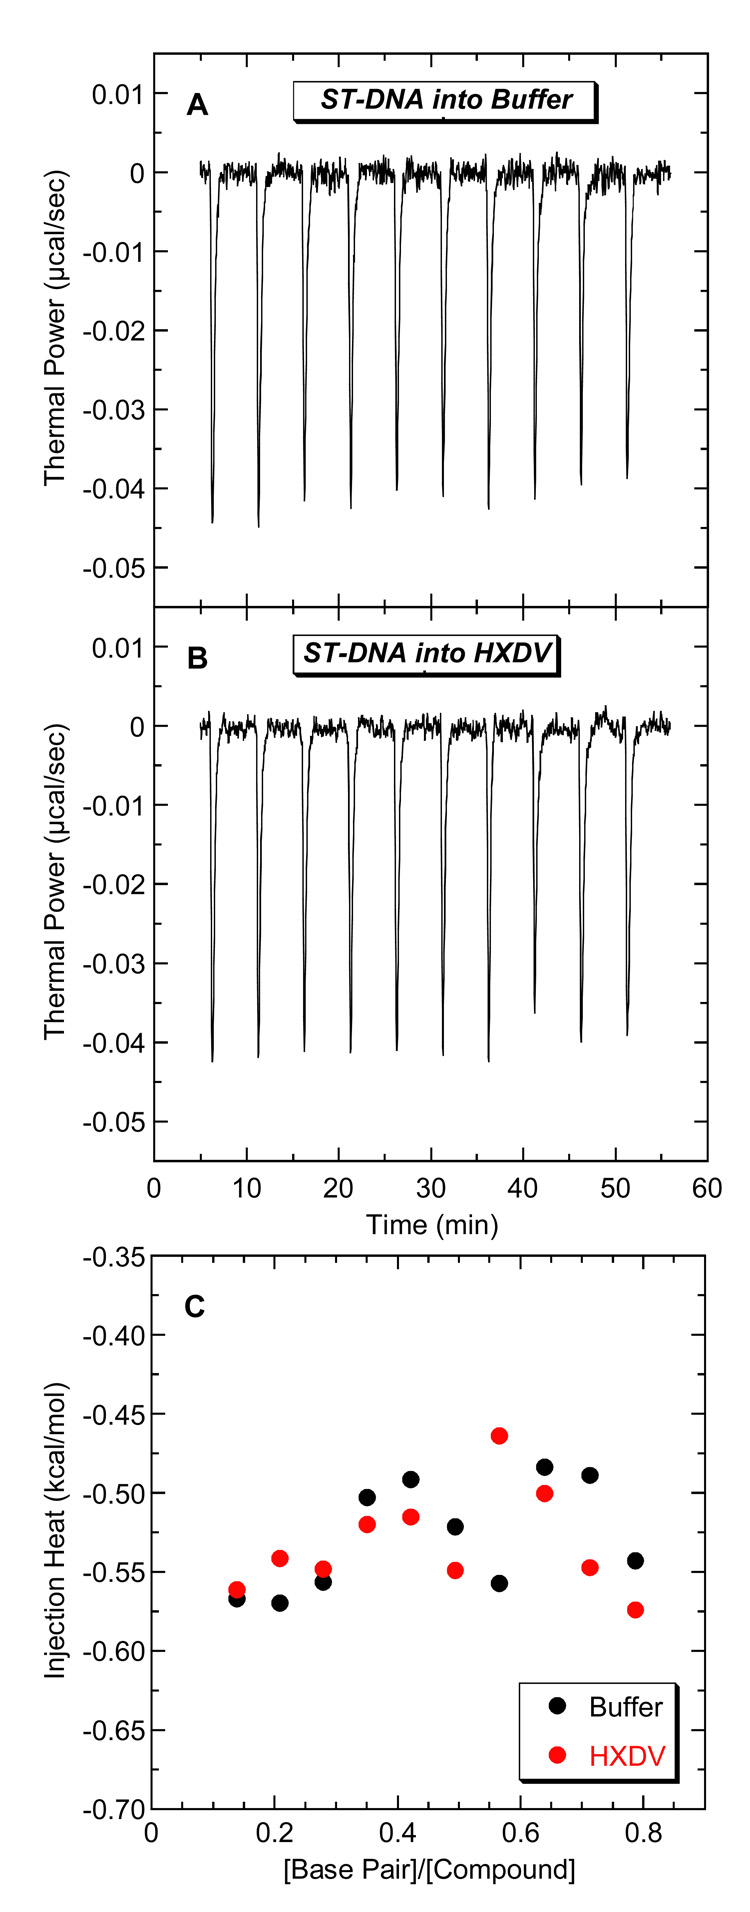
Fig. 3.
ITC profiles at 25 °C for the titration of ST-DNA (200 µM in base pair) into a solution of either buffer alone (A) or 20 µM HXDV (B). Each heat burst curve in panels A and B is the result of a 10 µL injection of ST-DNA. The solution conditions were 10 mM EPPS (pH 7.5) and sufficient KCl to bring the total K+ concentration to 50 mM. The data points in panel C reflect the integrated heats associated with the DNA injections into buffer (black) or HXDV (red).

