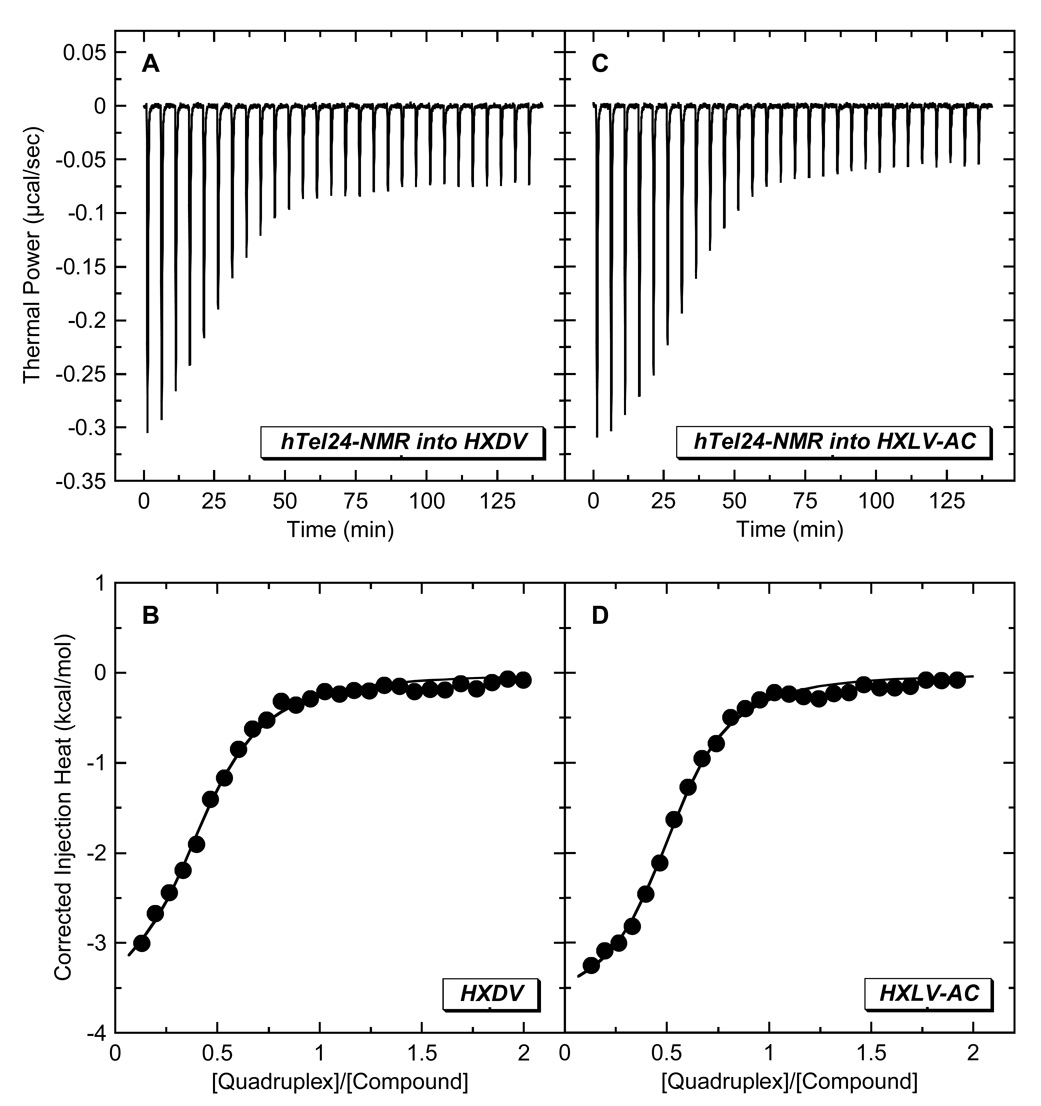
Fig. 6.
ITC profiles at 25 °C for the titration of hTel24-NMR (200 µM in strand) into a solution of either 20 µM HXDV (A,B) or 20 µM HXLV-AC (C,D). Each heat burst curve in panels A and C is the result of a 10 µL injection of DNA, with the solution conditions being as described in the legend to Fig. 3. The data points in panels B and D reflect the corrected injection heats, which were derived by integration of the corresponding heat burst curves in panels A and C, followed by subtraction of the corresponding dilution heats derived from control titrations of DNA into buffer alone. The solid lines in panels B and D reflect calculated fits of the data with a model for one set of binding sites.

