
Figure 2.
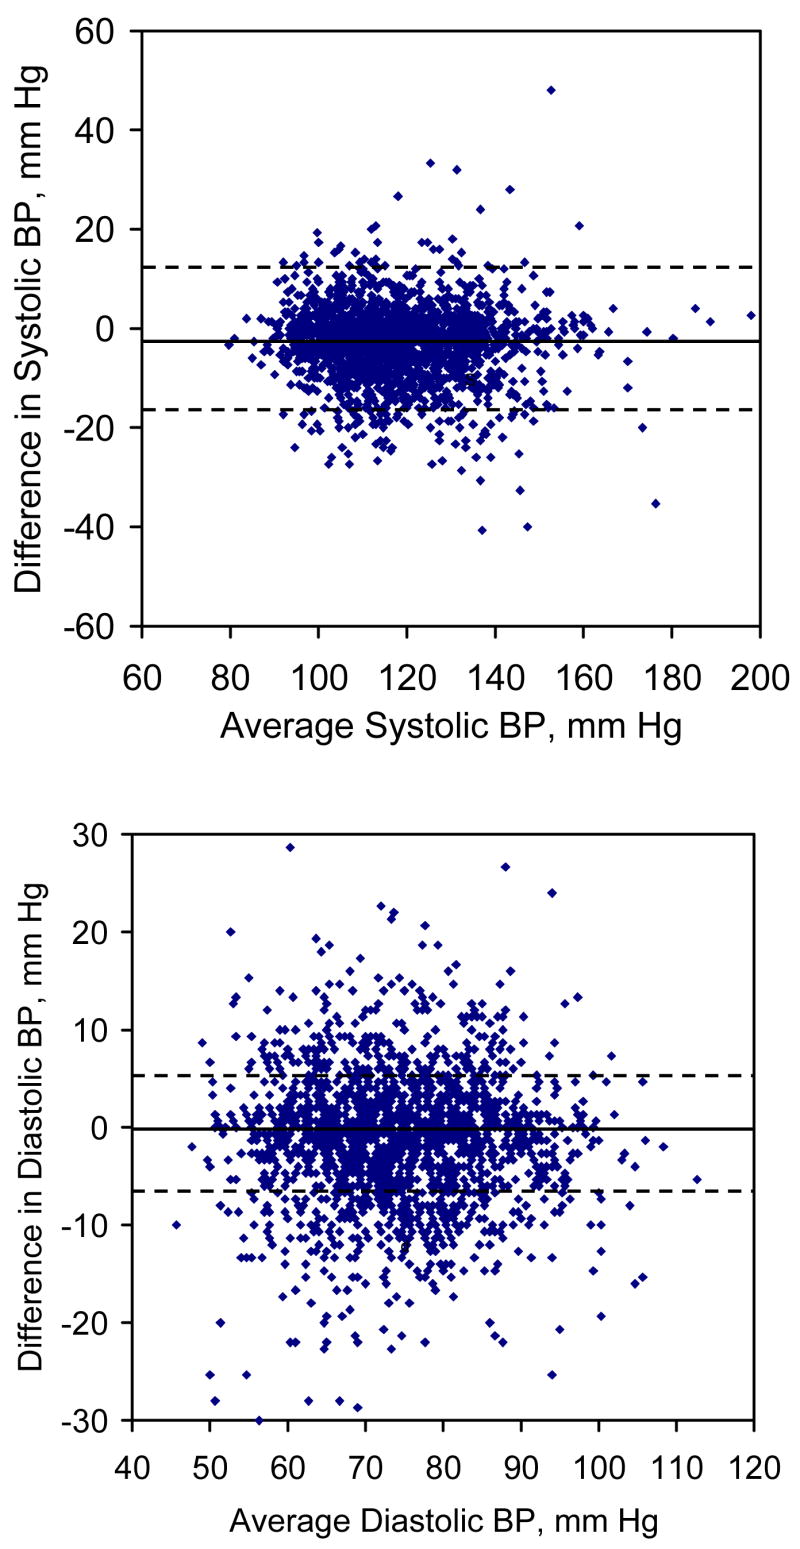
Scatter plots of difference in blood pressure measurements (random-zero – standard mercury) by average blood pressure levels from the two sphygmomanometers (upper panel for systolic and lower panel for diastolic blood pressure). The solid line indicates the mean blood pressure difference between random-zero and standard mercury sphygmomanometers. The dotted line indicates 1.96 times the standard deviation of this difference.