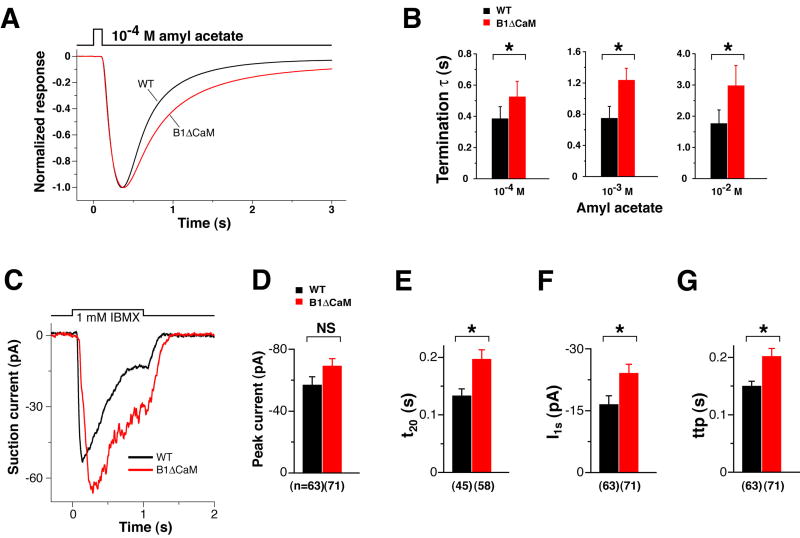
Figure 5. CNGB1ΔCaM OSNs displayed slower termination kinetics.
(A and B) EOG analysis.
(A) Normalized EOG signals to a 100 ms pulse of vapor of 10-4 M amyl acetate. The EOG traces of wild type (black) and CNGB1ΔCaM (red) mice, each the average from 6 animals, are superimposed to show the slower termination phase of CNGB1ΔCaM mice.
(B) Time constants of the termination phase. The termination phase (100% – 10% peak) of each response was fitted with a single exponential. *, p<0.05 for 10-4 M; p<0.01 for 10-3 M and 10-2 M (Student’s t-test).
(C – G) Single cell suction electrode recordings in response to a 1-second IBMX exposure. Examples of a wild type OSN (black) and a CNGB1ΔCaM OSN (red) are shown in (C). Collected results from multiple recordings are shown in (D – G).
(D) The difference in the peak current between the two genotypes is not significant (NS, p=0.05 Student’s t-test). The number of recordings is provided in parenthesis below the graphs.
(E) In CNGB1ΔCaM OSNs, the time for the current to decline to 20% of the end-perfusion value is significantly longer, meaning slower termination kinetics (*, p<0.01).
(F) Consistent with the EOG data (see Figure 8B), CNGB1ΔCaM OSNs retained significantly larger currents at the end of stimulation compared to wild type, meaning attenuated adaptation (*, p<0.05).
(G) Consistent with the EOG data (see Figure 8C), CNGB1ΔCaM OSNs have a longer time to peak in response to sustained stimulation (*, p<0.01).

