
Figure 2.
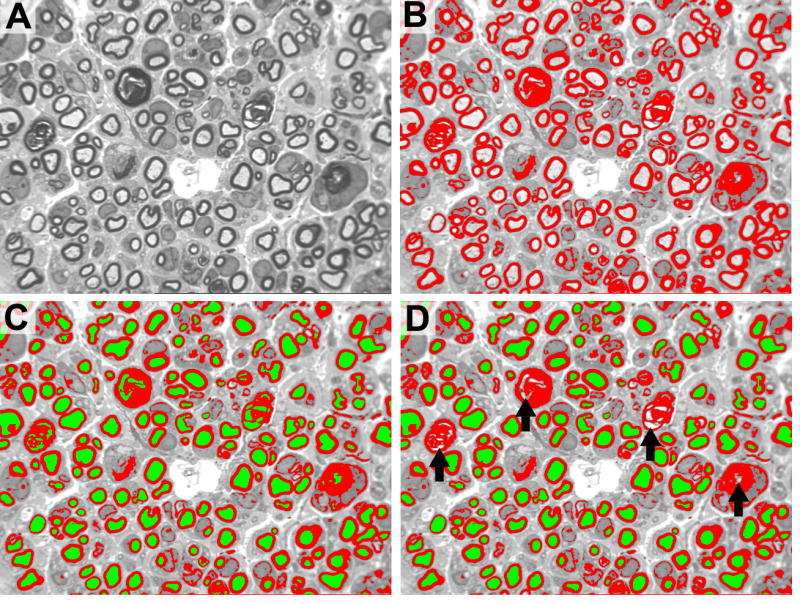
A. Original gray scale image. B. Red myelin bitplane. During the initial manual myelin thresholding step, all gray level profiles are colored red. C. Axon bitplane. All features with myelin thresholded are colored green. D. Manual elimination of non-axon features initially colored green by the program. Black arrows demonstrate areas where incorrect axon identification is manually eliminated.