
Figure 6.
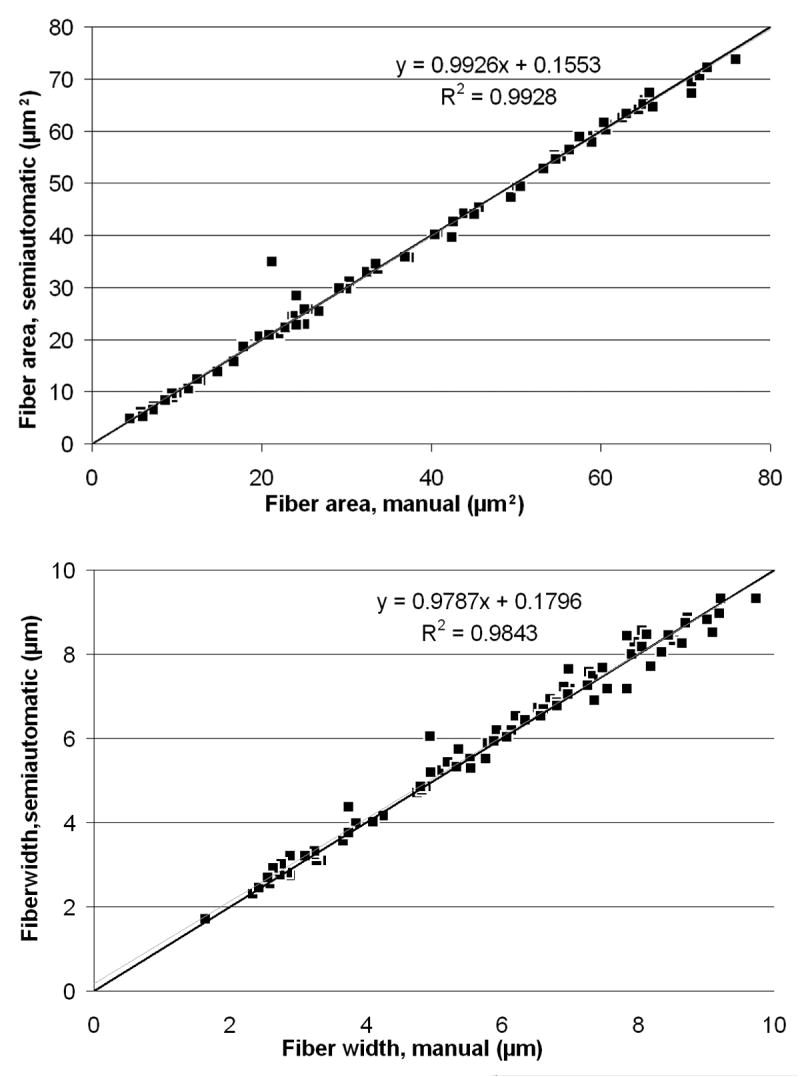
Regression Analysis. A. A comparison of fiber area between manual and semiautomated methods. B. A comparison of fiber width between manual and semiautomated methods. In both images, the black line is y=x; the blue line is the line of best fit for the data, for which the equation and correlation coefficient are displayed on the graph.