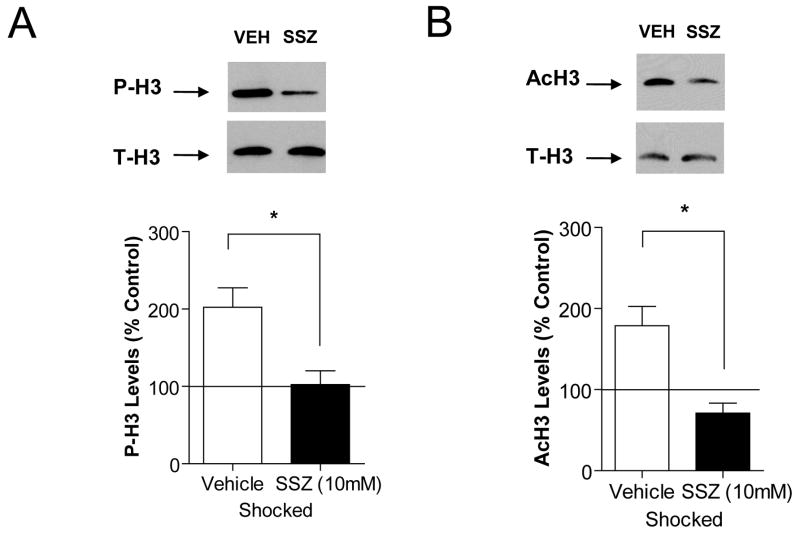
Figure 6.
IKKα contributes to increases in histone H3 phosphorylation and acetylation during reconsolidation. (A) Quantitative analysis of phosphorylated histone H3 (P-H3) levels after re-exposure to the training chamber are shown. (unshocked, n=4; shocked-vehicle, n=4; shocked-SSZ, n=4). (B) Western blot analysis of acetylated histone H3 (AcH3) levels from area CA1 after 10 mM SSZ treatment. (naïve, n=4; shocked-vehicle, n=4; shocked-SSZ, n=4). One-way ANOVA; *p<0.05, compared with unshocked-vehicle. Error bars are SEM; Solid lines represent normalized unshocked-vehicle control levels.

