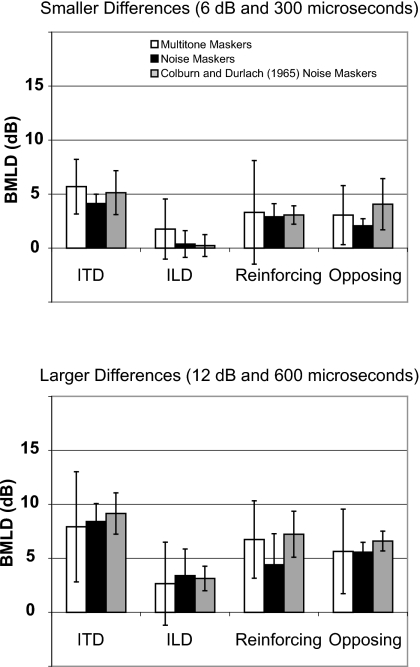
Figure 2.
Average BMLDs (differences between diotic thresholds and binaural thresholds) for four binaural conditions for smaller (upper panel) and larger (lower panel) binaural differences. Results for the noise maskers used in the current study (black bars) are plotted alongside the results reported by Colburn and Durlach (1965) for similar noise maskers (gray bars) and the results for the multitone maskers used in the current study (white bars). The error bars represent the critical interval (± two standard errors of the mean) based on seven listeners.

