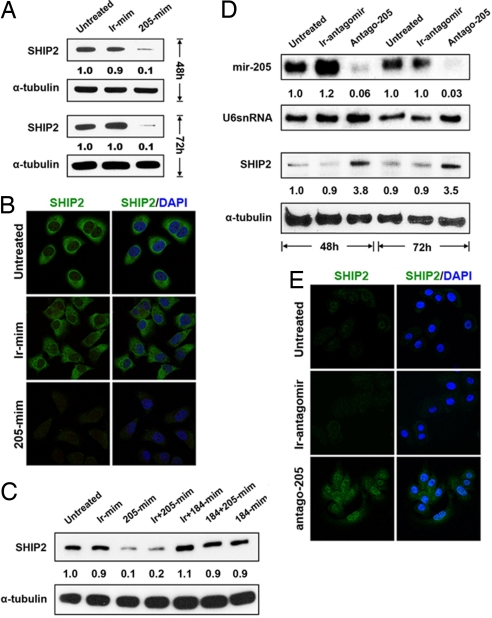
Fig. 2.
SHIP2 levels are controlled by miR-205 and miR-184. (A) Immunoblotting of SHIP2 in HeLa cells that were treated with a miR-205 mimic, decrease protein 48 and 72 h after treatment. (B) Immunofluorescence microscopy of HeLa cells stained with anti-SHIP2 and anti-SHIP2/DAPI showing a marked decrease in staining 72 h after treatment with miR-205 mimic. Staining data at 48 h is presented in Fig. S2A. (C) Immunoblotting of SHIP2 in HeLa cells that were untreated (1), transfected with an irrelevant mimic (ir-mim; 2), miR-205 mimic (205-mim; 3), miR-205 mimic plus and irrelevant mimic (ir + 205-mim; 4), miR-184 mimic plus an irrelevant mimic (ir + 184-mim; 5), miR-184 plus miR-205 mimics (184 + 205-mim;6), and miR-184 mimic (184-mim; 7) for 48 h. miR-205 mimic reduces SHIP2 levels (3, 4) whereas miR-184 inhibits miR-205 from reducing SHIP2 levels (6). (D) Northern analysis using a miR-205 specific probe showing a marked decrease in miR-205 levels in HEKs treated with an antagomir to miR-205 (Antago-205) for 48 and 72 h. Immunoblotting of SHIP2 and α-tubulin in HEKs shows an increase in SHIP2 expression 48 and 72 h after treatment with Antago-205. (E) Immunofluorescence microscopy of HEKs stained with SHIP2 showing an increase in staining after 72 h of treatment with Antago-205. Staining data at 48 h are presented in Fig. S2B. Numbers below the panels represent the normalized expression signal of proteins and RNAs.

