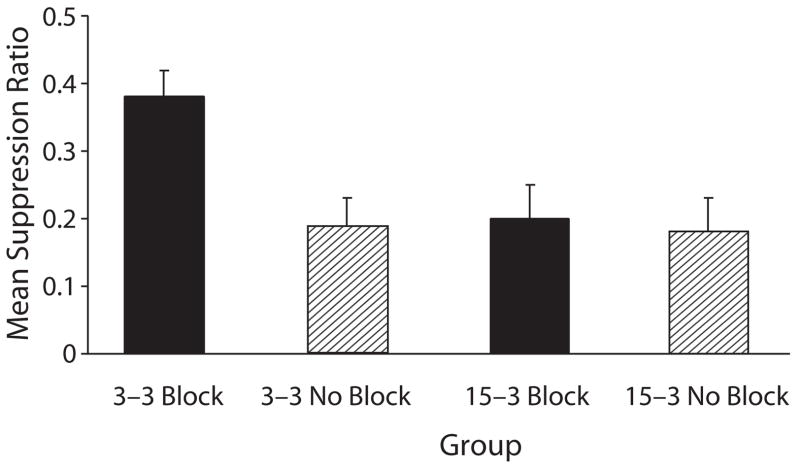
Figure 3.
Mean suppression ratio in Experiment 3 of the testing of Cue x (i.e., block of four trials). Group 3–3 Block was the group in which weak responding to x was expected because of the blocking of Cue x by Cue A. Conversely, Groups 15–3 Block, 3–3 no Block, and 15–3 no Block were those in which strong responding to Cue x was expected (see table 3). the error bars represent standard errors of the means.

