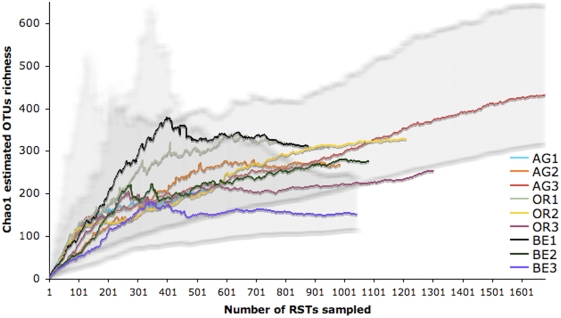
Figure 4. Alpha diversity at Río Tinto study sites.
Non-parametric richness estimator Chao1 variation with sampling effort for RT sites. Shadowed areas are 95% confidence intervals of the highest and the lowest richness samples showing overlap of all sites in their estimated OTU richness for the same sampling effort. For site names see Fig 1.

