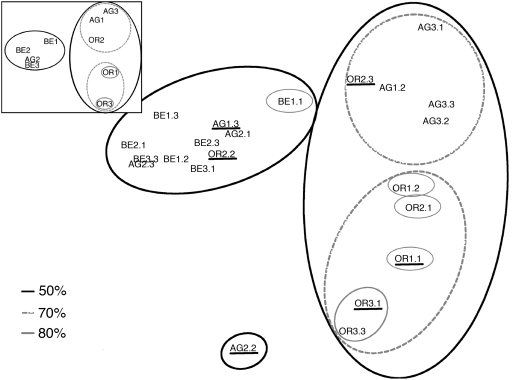
Figure 5. Beta diversity among Río Tinto samples and sites.
Non-Metric Multi-dimensional Scaling plot of Morisita-Horn beta diversity indices among the different RT samples and sites (inset). Superimposed circles represent UPGMA clusters of samples (or sites) at similarity values of 50, 70 and 85%. Underlined samples represent samples wherein ACE and Chao1 richness estimators do not level-off (Table 1). For sample names see Materials and Methods.

