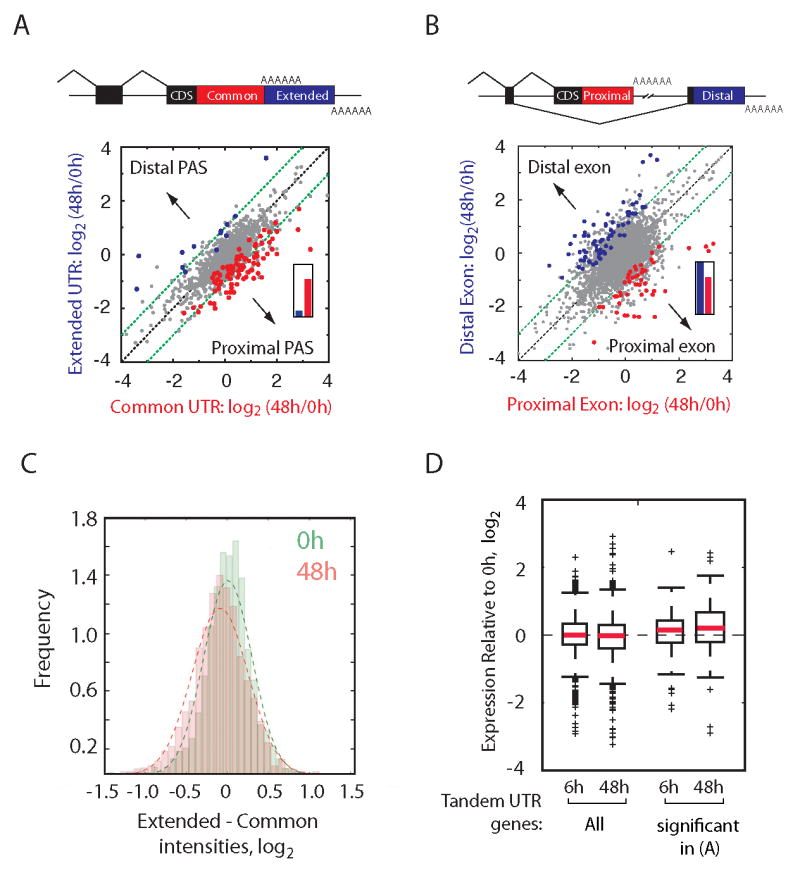
Figure 1. Reduced relative expression of extended 3′ UTR regions 48h after T lymphocyte activation.

(A) Scatter plot of common and extended UTR region expression of tandem APA genes in resting and stimulated (48h) T lymphocytes. Significantly increased expression of isoforms resulting from distal PAS (blue) or proximal PAS (red) (P < 0.02, 20% FDR) are colored. Inset: Direction of change (13 distal, 86 proximal; P < 2.3×10⁻¹⁴, binomial test). (B) Relative expression of mutually exclusive 3′ exons in resting and stimulated (48h) T lymphocytes. Significant events (P < 0.0031; 5% FDR) and inset are as in (A). (C) Expression of common versus extended 3′ UTR regions in resting (0h, n = 1768) versus activated (48h, n = 1761) cells. Difference P < 6.6×10⁻¹⁹, t-test. (D) Relative expression (activated/resting) of all tandem UTR genes and in the set of significant events from (A) after stimulation.
