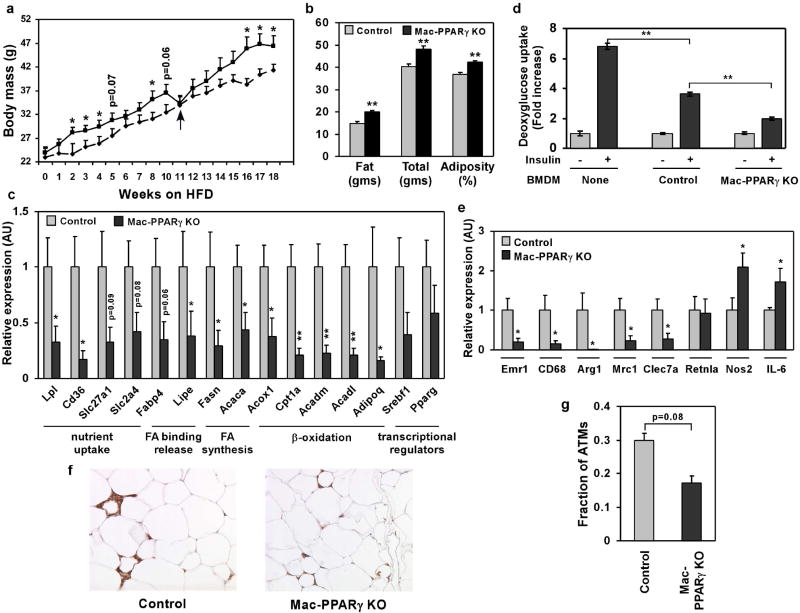
Figure 3.
Alterations in adipose tissue mass and function in Mac-PPARγ KO mice. a, Weight gain of control and Mac-PPARγ KO mice on a HFD. Arrow denotes period when mice were fasted for glucose and insulin tolerance tests. b, Body composition as determined by DEXA (n=5/genotype). c, Q-PCR analyses of gonadal adipose tissue gene expression. Relative transcript levels of genes involved in adipocyte differentiation and function. Lpl, lipoprotein lipase; Cd36, fatty acid translocase; Slc27a1, fatty acid transporter 1; Slc2a4, glucose transporter 4; Fabp4, fatty acid binding protein 4; Lipe, hormone sensitive lipase; Fasn, fatty acid synthase; Acaca, acetyl-Coenzyme A carboxylase a; Acox1, acyl-Coenzyme A oxidase 1; Cpt1a, carnitine palmitoyltransferase 1a; Acadm and Acadl, medium- and long-chain acyl-CoA dehydrogenase; Adipoq, adiponectin; Srebf1, sterol regulatory element binding factor 1c. d, Co-culture of macrophages with adipocytes decreases insulin-stimulated glucose uptake. BMDMs from control or Mac-PPARγ KO mice were co-cultured with differentiated 3T3-L1 adipocytes for 48 hours. 2-deoxyglucose uptake was assessed 30 minutes after stimulation with insulin. e, Q-PCR analyses of macrophage gene expression in WAT from control and Mac-PPARγ KO mice. Emr1, F4/80; Cd68, macrosialin; Arg1, arginase I; Mrc1, mannose receptor; Clec7a, dectin-1; Retnla, resistin like alpha; Nos2, inducible nitric oxide synthase; IL-6, interleukin-6. f-g, Macrophage content of epididymal adipose tissue. Representative sections of epididymal fad pads stained with F4/80 (Emr1) antibody (f). Fraction of ATMs is equal to F4/80-stained cells/total cells counted in the fields (g), and statistically analyzed using the paired t-test.

