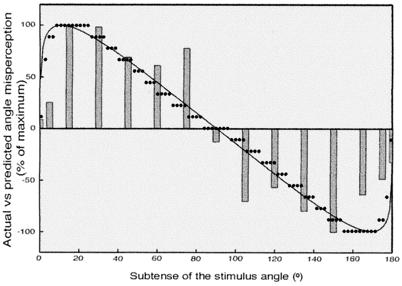
Figure 6.
Comparison of the perceptions of angular stimuli observed by the five subjects studied in detail and the misperceptions predicted by the frequency distributions of the possible sources of the angular stimuli (calculated in the same way as the mean and median values for the examples shown in Fig. 3). Vertical bars show the mean perceptual performance data from the three tests of angle perception shown in Fig. 4, normalized here for comparison with the functions predicted by the geometrical analysis in Fig. 3. The solid line indicates the misperceptions predicted by the means of the frequency distributions of the possible sources for each angle; the dots indicate the misperceptions predicted by the medians of the source frequency distributions. The maximum misperception of acute and obtuse angle stimuli predicted by the frequency distributions of experience with the subtenses of the sources of projected angles is ≈10° and 4.5° per angle arm for mean and median, respectively, compared with observed values of about 1–3°. The inevitable presence of some information about the actual orientation of the stimulus in frontal plane (subjects were obviously aware they were viewing a computer screen) may explain why the magnitude of the perceptual distortions seen by observers is a few degrees less than that predicted on the basis of the frequency distributions of the possible sources (i.e., angular objects in the frontal plane have always been experienced to have the same real-world subtense as their retinal projections).

