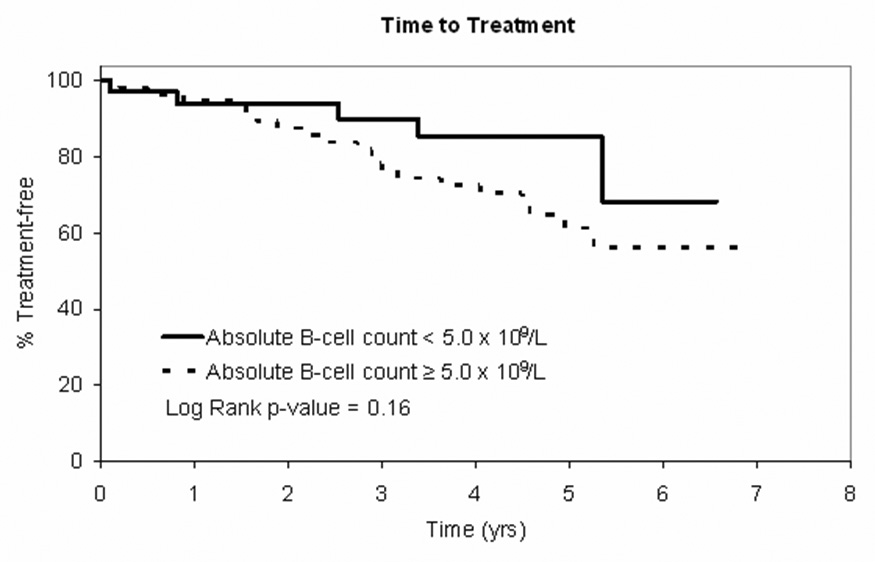
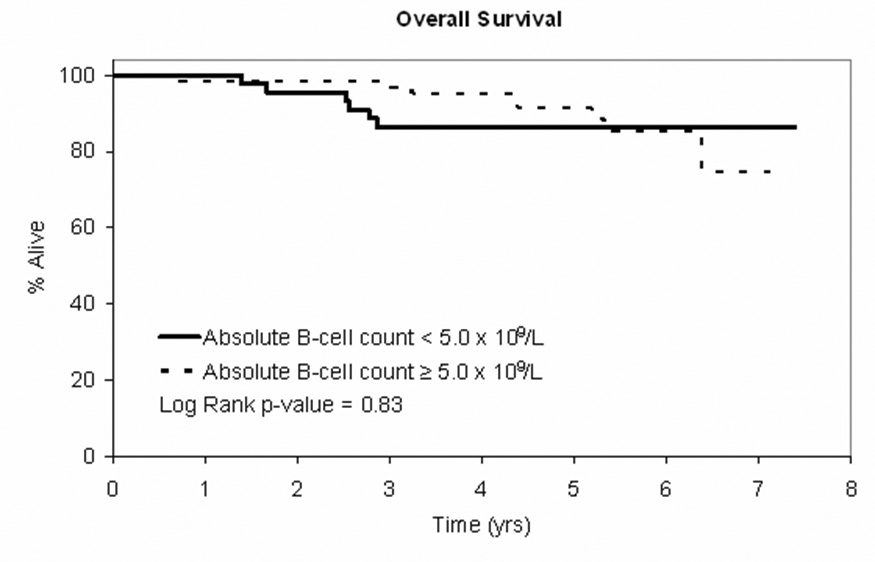
Figure 2. Clinical Outcomes by B-cell Count.


Figure 2A: Time to treatment curve for patients with Rai stage 0 CLL at diagnosis (NCI 1996 criteria) based on absolute B-cell count <5.0 × 10⁹/L (n=47) vs. B-cell count ≥5.0 × 10⁹/L (n=65)
Figure 2B: OS curve for patients with Rai stage 0 CLL at diagnosis (NCI 1996 criteria) based on absolute B-cell count <5.0 × 10⁹/L (n=47) vs B-cell count ≥5.0 × 10⁹/L (n=65)
